How can business intelligence improve the efficiency of your business, and what data engineering tools are required to set it up?


In today’s digital age, businesses are constantly seeking ways to optimize operations and drive growth. Business intelligence (BI) has emerged as a game-changing solution that enables organizations to make informed decisions based on data-driven insights. However, establishing effective BI requires utilizing a great variety of data engineering tools and understanding some complicated tech concepts.
To make them a bit easier to understand, in this article, we will explain the meaning of business intelligence, explore its impact on businesses, and highlight the essential data engineering tools required to establish an effective BI strategy.
BI software and other data engineering tools make data understandable for users
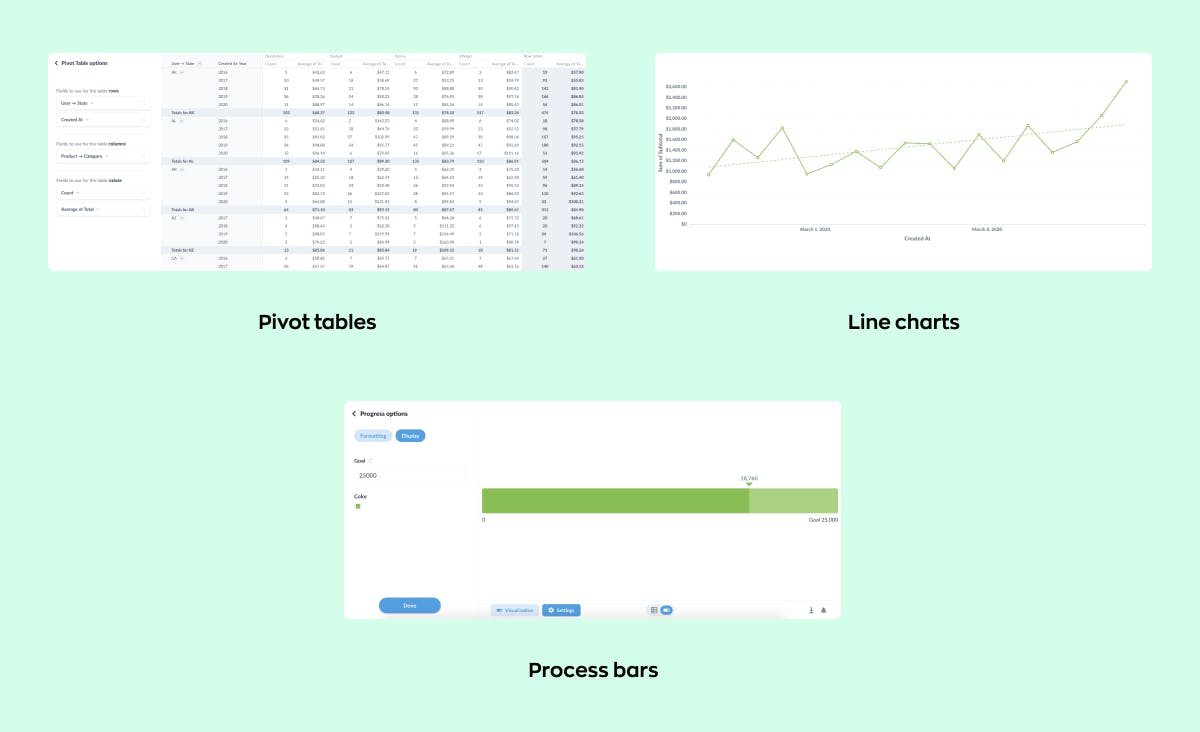
Business intelligence, or BI, is a process of collecting and transforming data into easily understandable formats like graphs, tables, and written reports. Within the process, users can make queries to existing data and receive reports upon request. As a part of business intelligence strategy, different data engineering tools are used to collect diverse enterprise information, including internal data, data from external services like CRM, historical and current data, as well as unstructured data, like social media data or online reviews.
Within the BI approach, data engineering tools not only give data a clear structure for the average person to understand but also help solve the problem of data storage. Thanks to them, entrepreneurs become unconditional owners of the data about their company that was collected over a long period. Data engineering tools and business intelligence practices allow storing this data in their own data warehouses and always have access to it, even if a third-party service ceases to exist or is compromised by hackers. To find out more about how to improve your business through corporate data analysis, read our article on data analytics consulting.
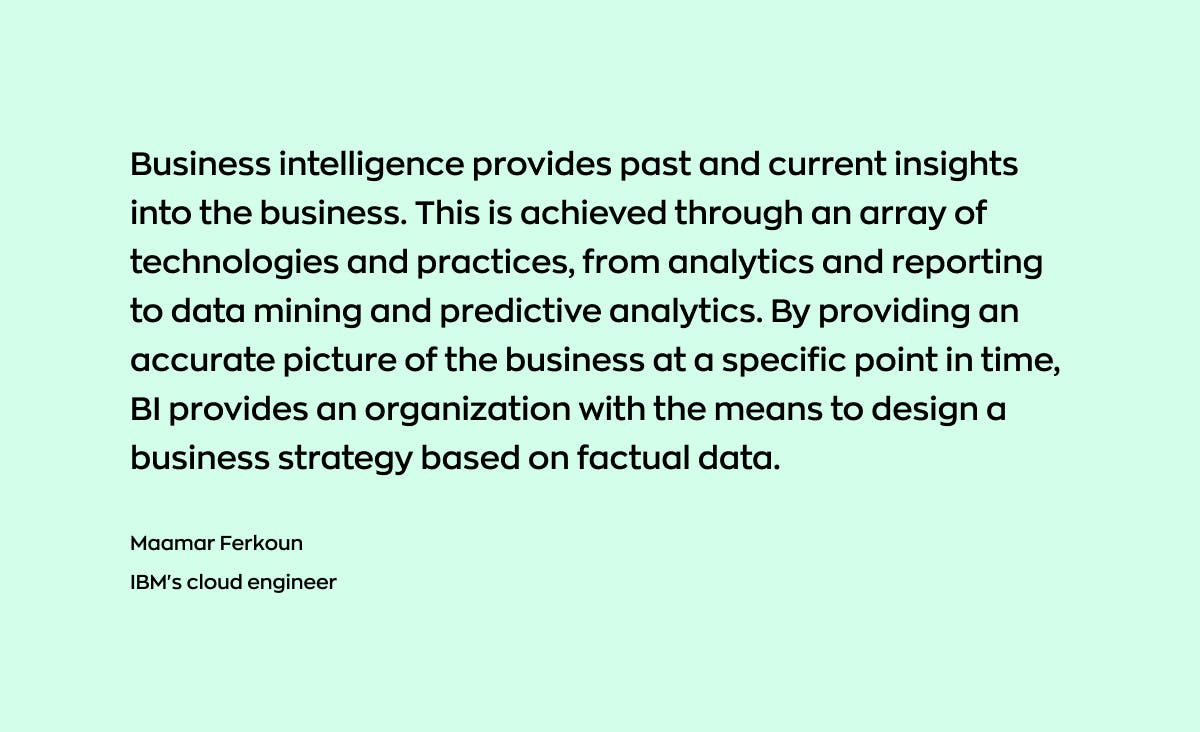
The term business intelligence was first mentioned in 1865 and referred to a banker who had collected intelligence about the market before his competitors did. Nowadays the BI strategy is used by many companies worldwide, the list includes Coca-Cola, American Express, Delta Airlines, IBM, and hundreds of others. That’s what Maamar Ferkoun, one of IBM’s cloud architects wrote about BI.
Business intelligence increases sales: Korean shop case study
Lotte.com, a leading internet shopping mall in Korea with 13 million customers, faced the challenge of customers frequently abandoning their shopping carts without completing purchases. That’s why they decided to run customer experience analytics and find some hints about customers’ behavior with the aid of data engineering tools.
Lotte implemented a statistics analytics application for customer experience analysis, which was the first statistical app used in Korea. Having accessed data related to shopping carts, immediate purchases, wish lists, and purchase completions, the Lotte team found out that the key reasons for cart abandonment were the long checkout process and unpredictable delivery time. After fixing these problems and gaining new marketing insights, Lotte improved their service and saw an increase in customer loyalty and $10 million in sales as a result.
Business intelligence can help organizations with solving many other business tasks. Here’s a list encompassing only a few of them.
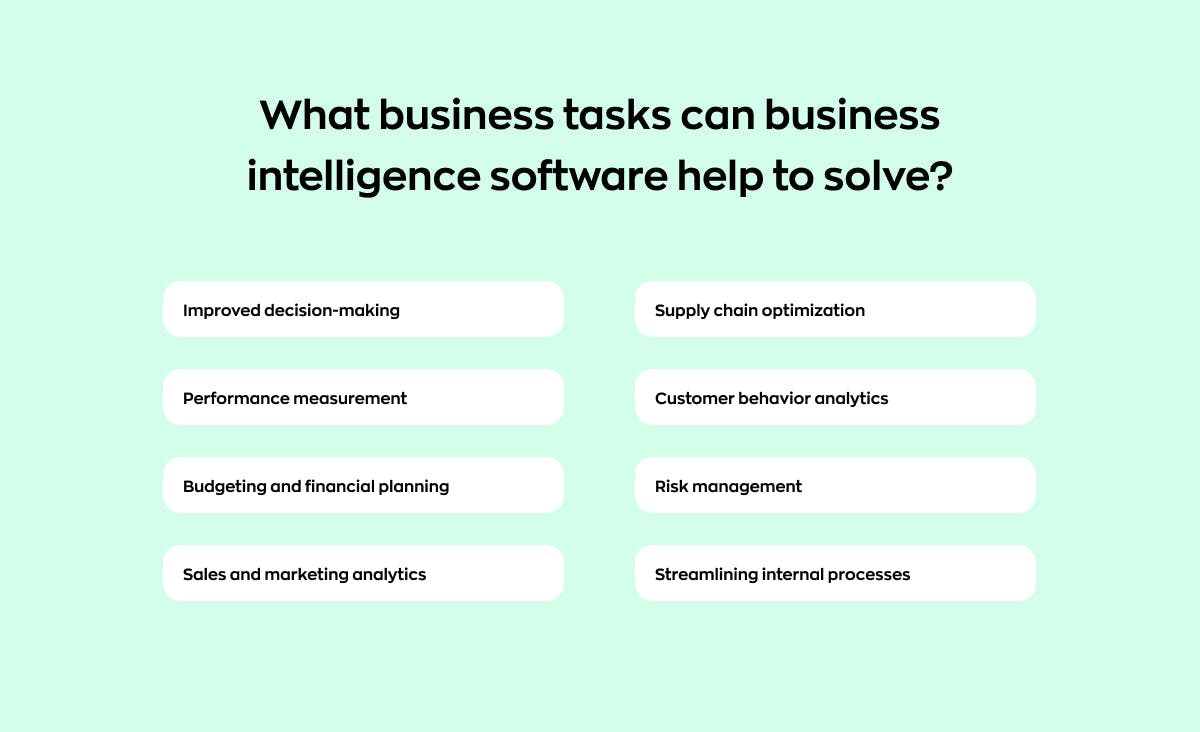
Would you like to use corporate data to solve all the above-mentioned issues? Fill out the form, and we’ll call you back to discuss.
Stages needed to establish prominent business intelligence within a company
All in all, business intelligence is a set of technologies and practices that can turn data into useful tools for solving many business problems. But behind the beautiful dashboards that we get as a result, there is a complicated structure of different data engineering tools that collect, store, and arrange the data so that it can be easily retrieved and used by non-tech users. Here’s the scheme that shows how the technical part of business intelligence can be organized.
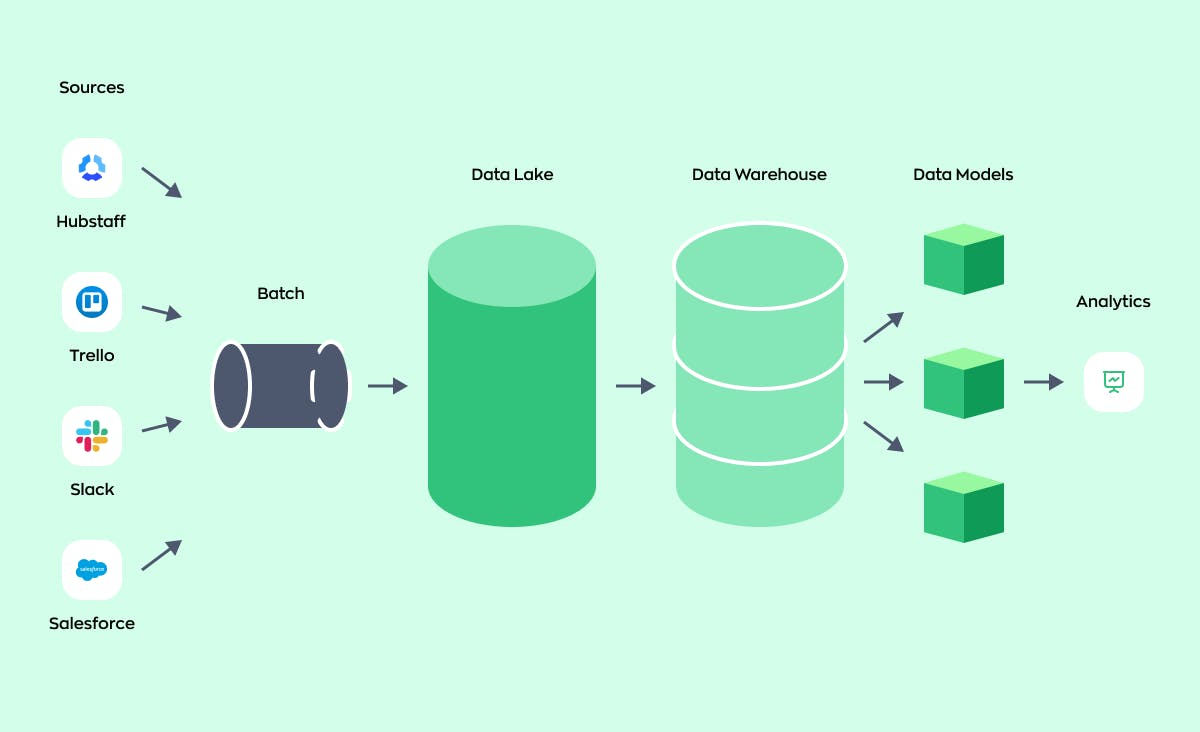
First, let’s find out what are the parts of this scheme. All of them are necessary to establish clear data processing and improve internal processes with the help of business intelligence strategies.
- Gathering data from apps and services
At first, data from various applications and services of the company are collected into a single database. This can be data from a variety of applications: the company’s commercial application, CRM system, task tracker, and others. All of them will go into a data lake, which is a database where all the data are stored in their original form, ready for further interpretation.
- Transferring data to the data warehouse
After all the data is collected in the data lake, it is transferred to a data warehouse. A data warehouse is like a large storage room where a company keeps all its digital information. This data is stored in an organized and categorized way, just like how items in a physical warehouse are shelved and labeled. This makes it easier for the company to find, analyze, and use certain data when needed.
A data warehouse stores structured data, i.e., organized data that can fit neatly into tables and columns. On the other hand, a data lake stores both structured and unstructured data (like emails, videos, and social media posts), maintaining it in its raw, unprocessed form until it needs to be used. So, these two types of databases are different. The former is for raw data, while the latter is for structured data ready for analysis.
- Data modeling
Data modeling is the process of creating a ’model’ of how data is structured and organized in a system. It’s like creating a blueprint of data architecture that outlines how different elements relate to each other and operate within the system. This step helps data analysts establish the right connections between data elements and successfully translate complex data into comprehensible visualizations.
In essence, data modeling acts as a vital bridge between data storage and data visualization, ensuring the efficient usage and accurate representation of the stored data.
- Data visualization
At this stage, structured data is transformed into reports and dashboards that are easy to comprehend. The data warehouse serves as a source for structured data that is used in data visualization.
The resulting visuals or ’visualizations’ make the data more understandable and accessible. This process helps people see trends, patterns, and insights in the data that might not be easily understood from raw data alone. Find out more about data visualization and data engineering tools used for it in our article about the importance of data visualization.
Modern data management tech stack
After we have shown how the process of data collection, storage, and presentation works, let’s discuss what tools are typically used in this process. Currently, IT specialists working with data use a variety of data engineering tools to handle business intelligence. Here is just a small part of them.
To help you understand data engineering tools better, we’ll discuss the technologies and applications you’ll need if you want to set up Business Intelligence in your company. Knowing the right tools can greatly improve how your company manages its data.
Databases
In data management, databases are fundamental data engineering tools that operate as structured sets of data. They are organized in such a way that a computer program can quickly select desired pieces of information. Databases are critical for storing, retrieving, and managing data efficiently. All databases can be divided into three types, different businesses choose different types depending on their needs.
Cloud-Based Databases: These are databases hosted in a virtual environment, accessible from anywhere via the internet. The cloud provider typically manages infrastructure, reducing the overhead of hardware maintenance for businesses. These databases are prominent data engineering tools that offer ’s requirements without any significant upfront investment in hardware.
Examples: Providers like Amazon Web Services, Microsoft Azure, and Google Cloud offer popular cloud database services such as Amazon RDS, Azure SQL Database, and Google Cloud SQL.
Traditional Row-Based Databases: These are databases where data is organized in rows, with each row consisting of one record. Each record typically represents an entity like a customer or a transaction. These databases are excellent for transactional processing where operations are primarily done on a single record at a time. They are efficient in read/write operations and ensure data integrity but can be less efficient for analytical queries that require scanning entire columns.
Examples: Here data engineering tools include SQL databases like MySQL, Oracle Database, and SQL Server.
NoSQL Databases: NoSQL databases are designed for storing unstructured or semi-structured data, and can handle large volumes of data. Among the key strengths of NoSQL databases is their ability to scale horizontally — you can add more servers to handle increased data loads which makes them highly suitable for cloud-based solutions. Moreover, NoSQL databases support various data structures like key-value pairs, wide columns, graphs, or document types. This makes them highly adaptable and effective for managing diverse data priorities and workloads.
Examples: MongoDB, Cassandra, and Couchbase.
ELT solutions
The ELT process in data management stands for Extract, Load, and Transform. First, data is extracted (E) from various sources, then it’s loaded (L) into a data storage system, and finally, it’s transformed (T) into a usable format within the system itself. Here’s the list of data management tools used for each operation.
Extract: This step involves collecting data from various apps. Tools used for extraction include Apache NiFi, Apache Kafka, and AWS Glue.
Load: The extracted data is loaded directly into a data storage system. Loading tools often form part of larger platforms like AWS Redshift, Google BigQuery, and Azure Data Factory.
Transform: The data is then transformed into a usable format inside the storage system. Transformation data engineering tools include SQL for structuring and cleaning data, and other specialized tools like Apache Beam, dbt, and Apache Flink for complex transformations.
Data visualization software
Data visualization software is a set of data engineering tools that are connected to databases and the ELT process as they pull the transformed data from a database after it’s been through the ELT process. Once the structured and organized data is in a data warehouse, or a similar storage system, data visualization software then retrieves this data and helps visualize it in a more understandable and digestible format.
Tableau: Tableau is a powerful and user-friendly data engineering tool used worldwide. It allows users to create a vast range of static, animated, and interactive visualizations. It possesses strong data discovery and exploration capabilities, making it easy to convert plain data into meaningful insights.
PowerBI: PowerBI is a product of Microsoft that provides seamless integration with other services in the Microsoft ecosystem. It allows for robust data visualizations that can be highly customized according to the user’s needs. Its dashboard is interactive and accessible, allowing non-technical teams to visualize and analyze their data effectively.
Looker: Looker is a modern browser-based data platform that offers real-time visualization. Its strength lies in creating interactive and self-explanatory dashboards that aid in collaborative work. It’s agile and perfect for businesses that require real-time insights.
Metabase: Metabase is an open-source data visualization tool that offers a simple way to generate charts and dashboards. Our company uses Metabase extensively for various purposes, such as monitoring marketing performance and tracking OKR results. Its ease of use, coupled with its powerful features, makes it a preferred choice for both technical and non-technical teams.
Infrastructure
To establish clear operations with data, there is a need to set up IT infrastructure and deploy IT environments. Data management indeed IT environments to run efficiently and effectively. This is important because a robust IT environment provides the necessary infrastructure for storing, processing, and analyzing vast amounts of data reliably and securely. It facilitates the seamless operation of data-intensive tasks such as data extraction, transformation, and loading (ETL), data analysis, and data visualization.
Our team uses the code-based tool Terraform for infrastructure management. We also use Docker and Kubernetes when working with infrastructure. We recently published a detailed article about Ronas IT approach to infrastructure work, so follow the link to learn more about our methodology. There are many other cool tools for managing infrastructure, we’ll enumerate them below.
Other cool tools for working with infrastructure: Ansible, Puppet, Chef, Google Cloud Platform, Microsoft Azure, and others.
Working with data and the development of robust business intelligence within your company also requires many other IT services like GitLab and GitHub version control software, CI/CD, and other technologies.
Wrapping up
As you may have noticed, you will need to familiarize yourself with many data engineering tools if you want to apply business intelligence in your company. To get the most out of this approach and to set it up quickly and without hassle, you’ll need to seek help from an IT specialist or an IT agency.
By the way, our company already has expertise in using all the above-mentioned tools and can assist with setting up business intelligence. The Ronas IT team can help you organize the storage of important corporate data from different applications and transform it into understandable graphs and reports. If you’re already thinking that you need help with this, fill out the form below.
Looking for a team to set up business intelligence and select suitable data engineering tools for your company? Fill out the form, and we’ll call you back to discuss.