US-based web platform for real estate investments
Design and development of a web platform with an admin panel, CRM integration, and AI-based analytics
This project was developed under NDA, so all brand and product names have been anonymized.
Project idea
Our client, a real estate investment company from the USA, needed a better way to manage their business processes. Their existing tools made it hard to keep track of deals, analyze the market, and handle their group of properties. They wanted one real estate online platform to help them buy properties, work with clients, and check performance. The system had to be secure and able to grow with their needs.

Services we needed to deliver
Develop a secure, scalable MVP web application
UI/UX design
Mind map
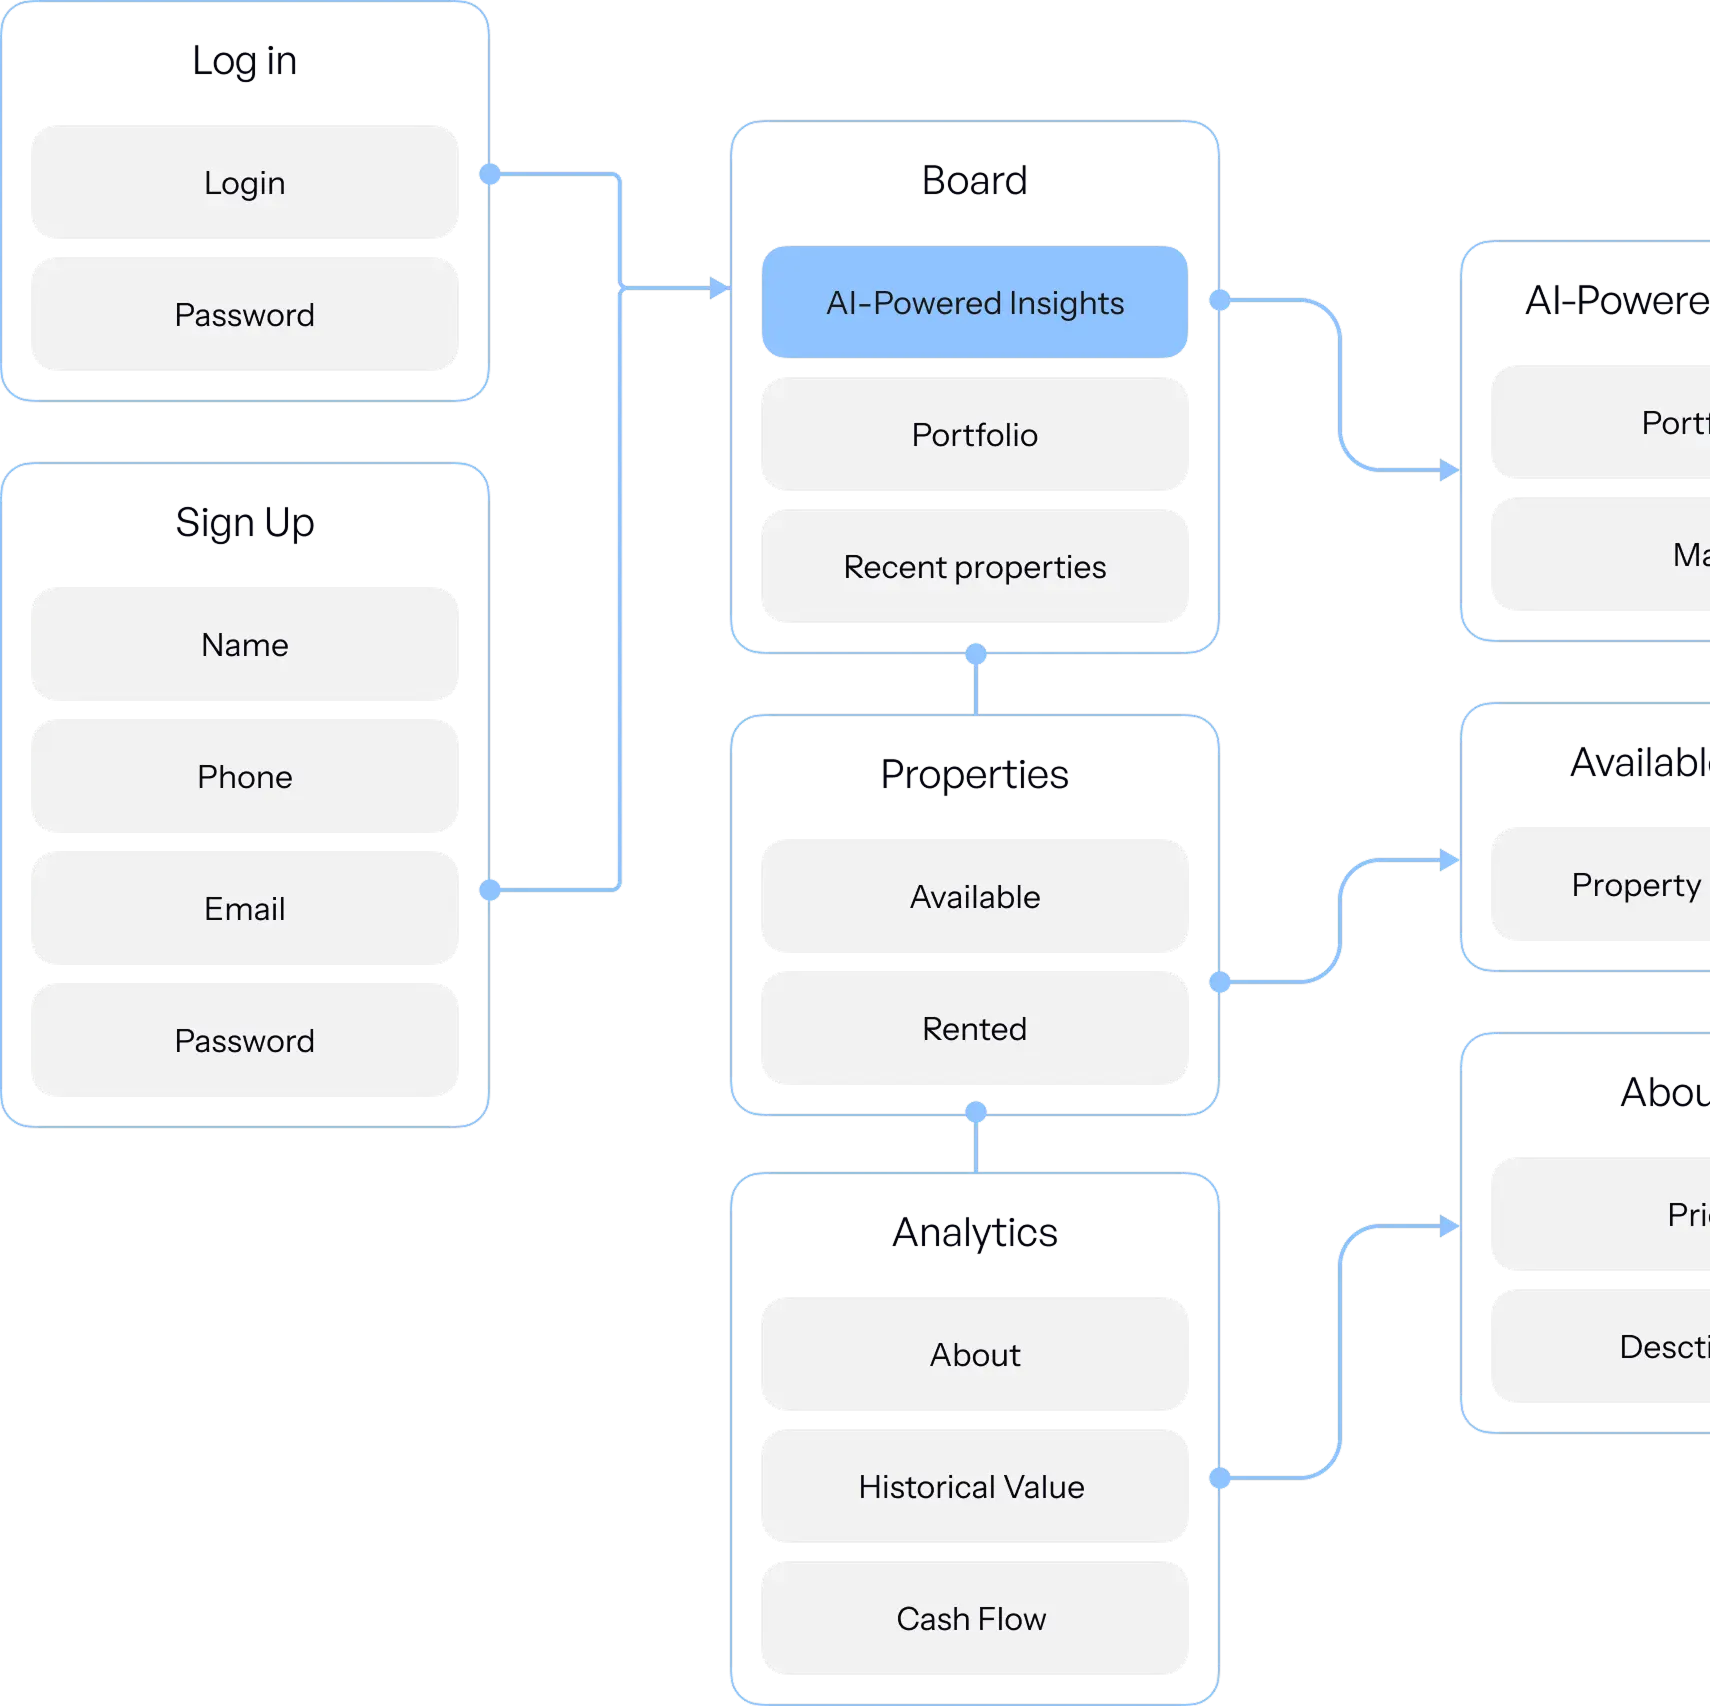
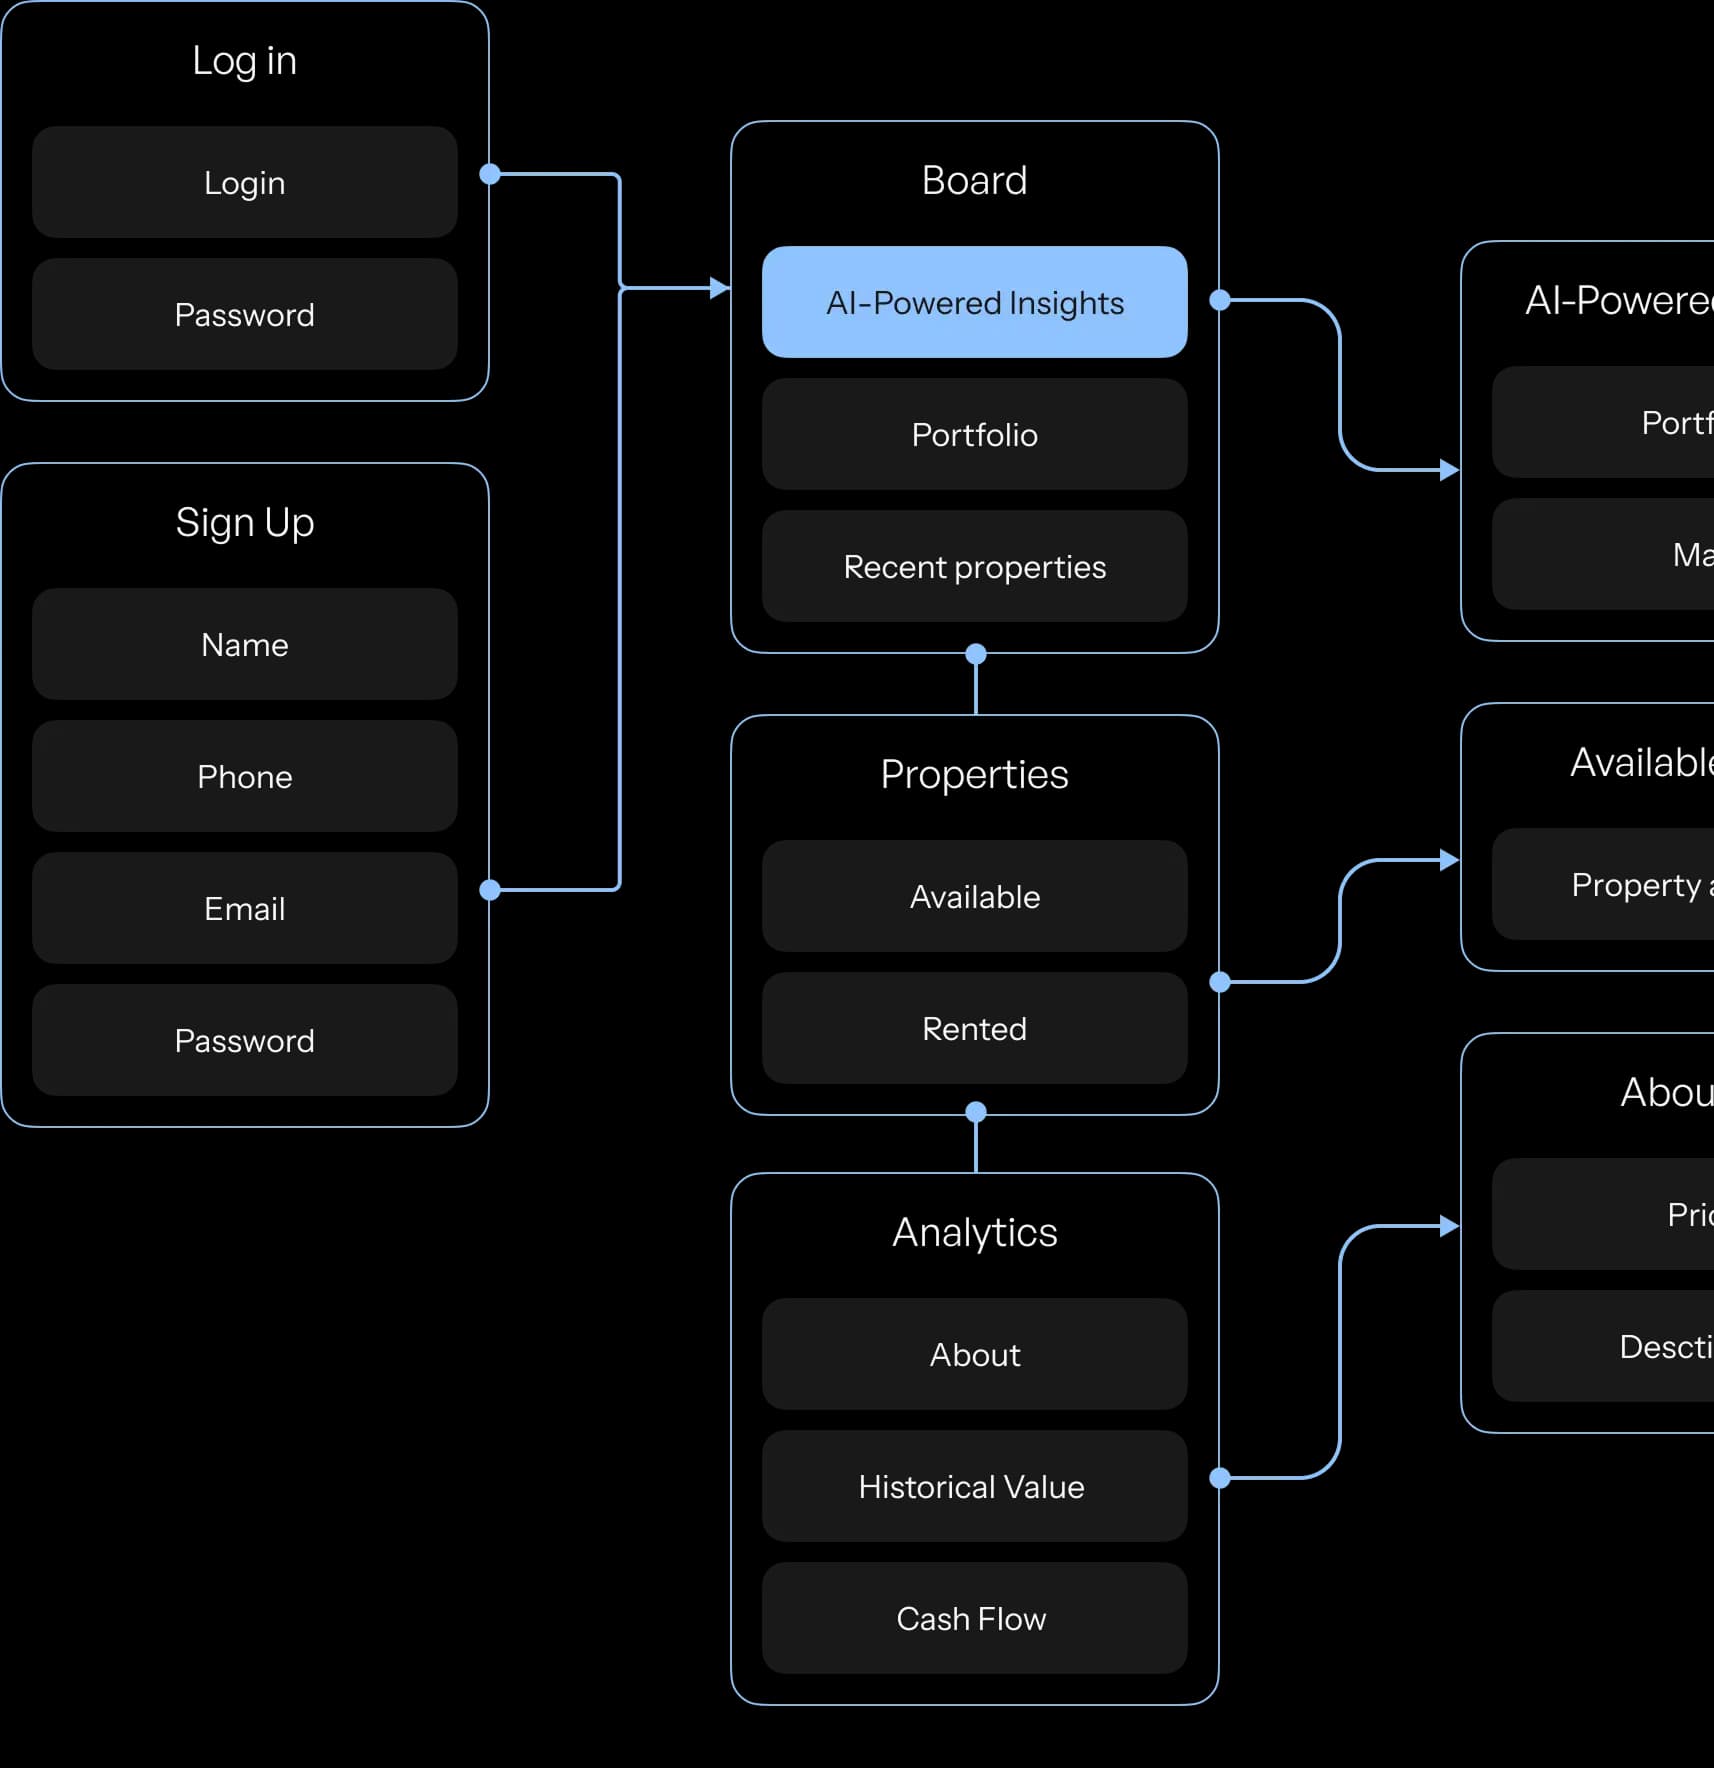
We started UI/UX design by mapping out how the company buys properties, manages its portfolio, and works with clients. We created a mind map to show how data moves between users and to make sure the platform supports every part of the business.
Visual concept
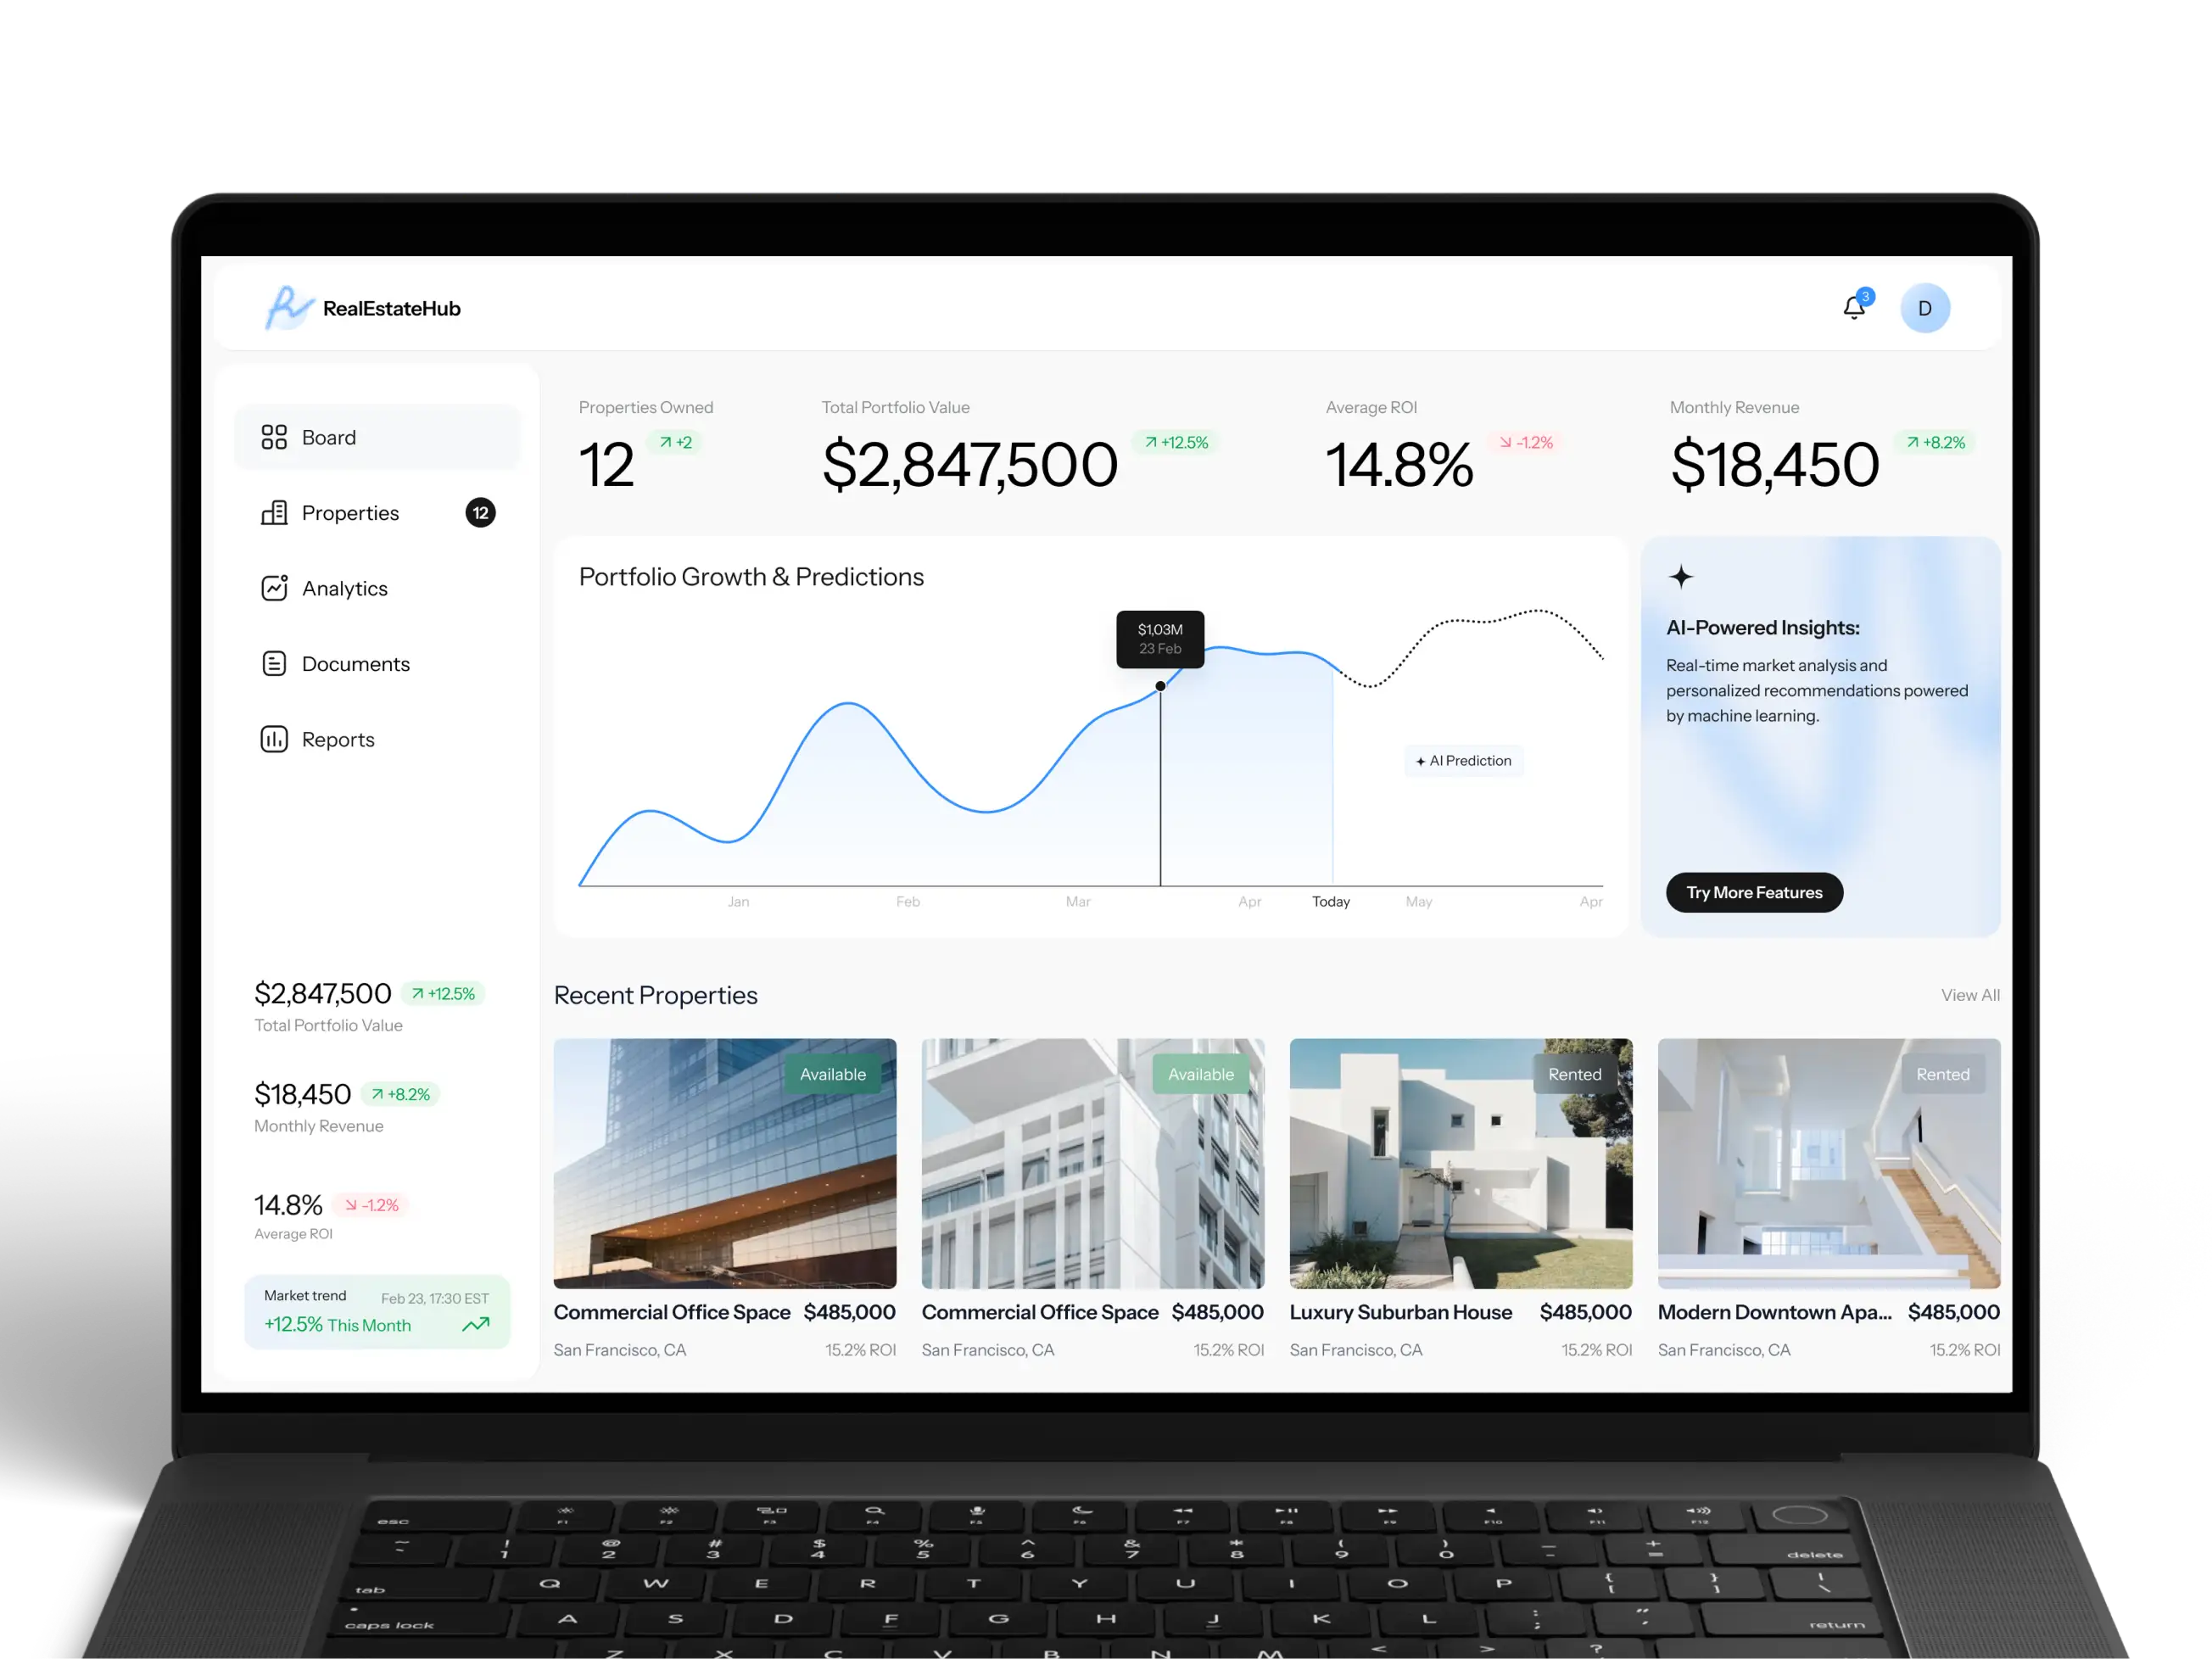
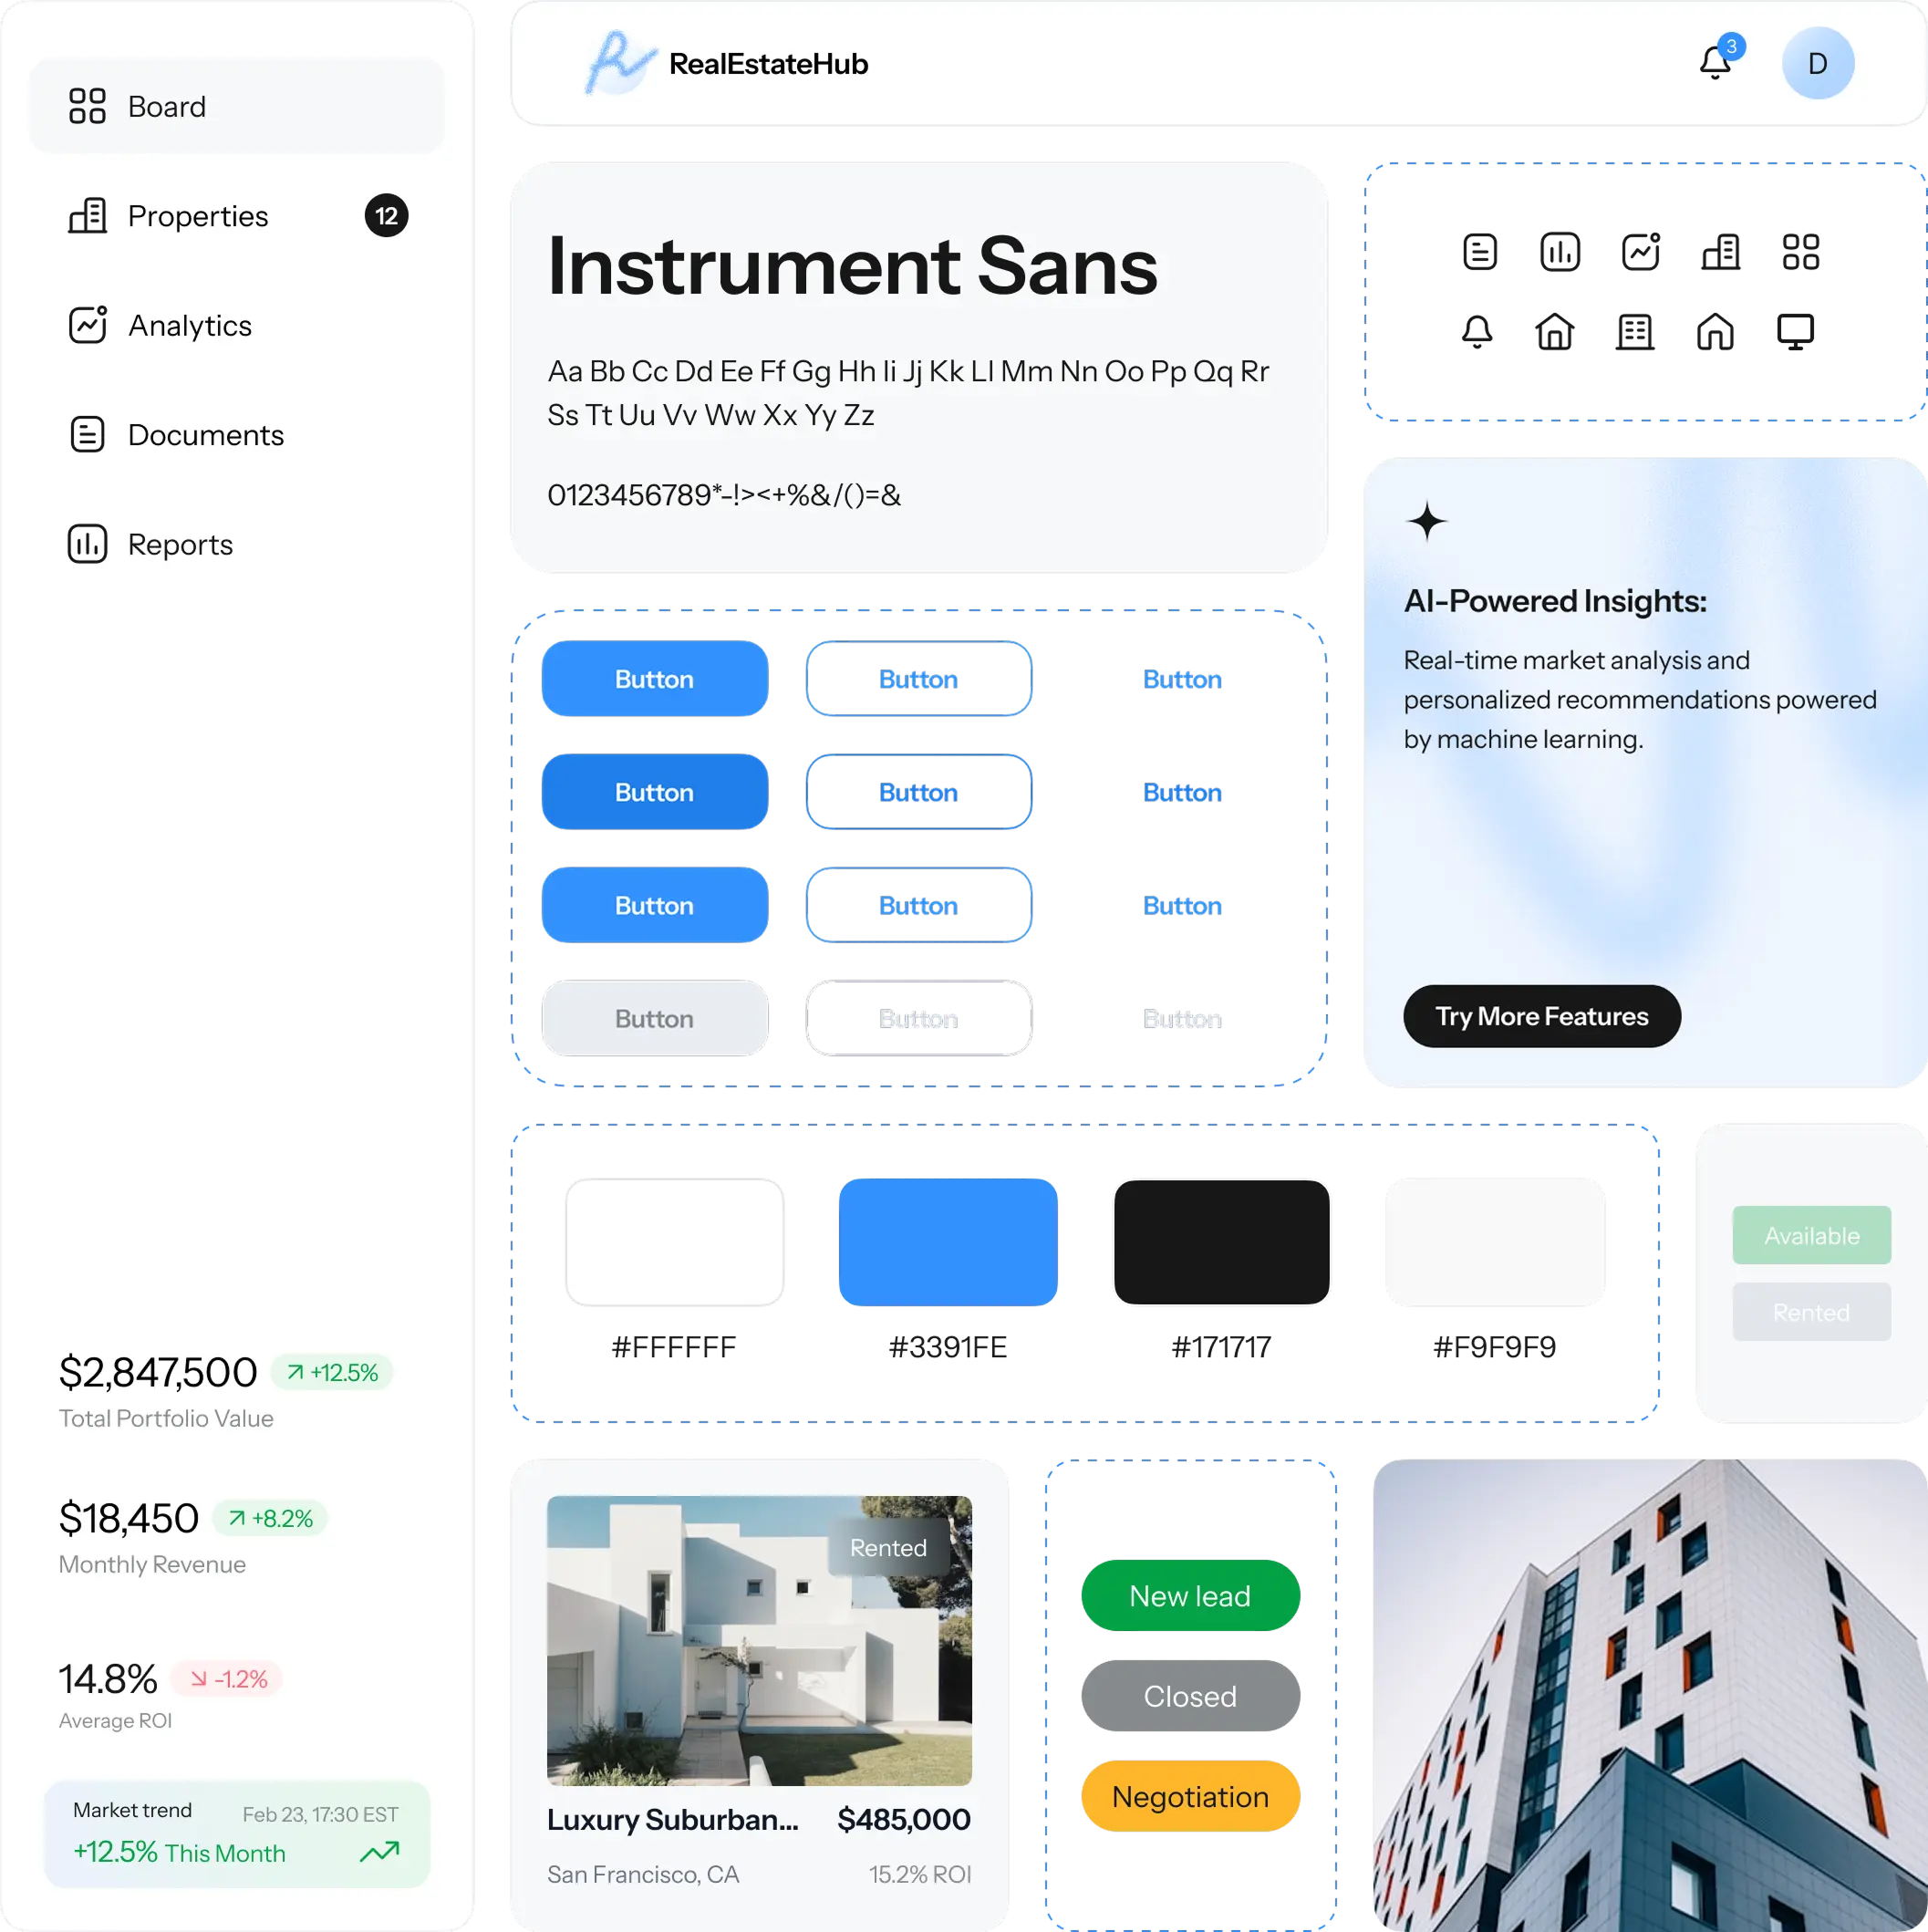
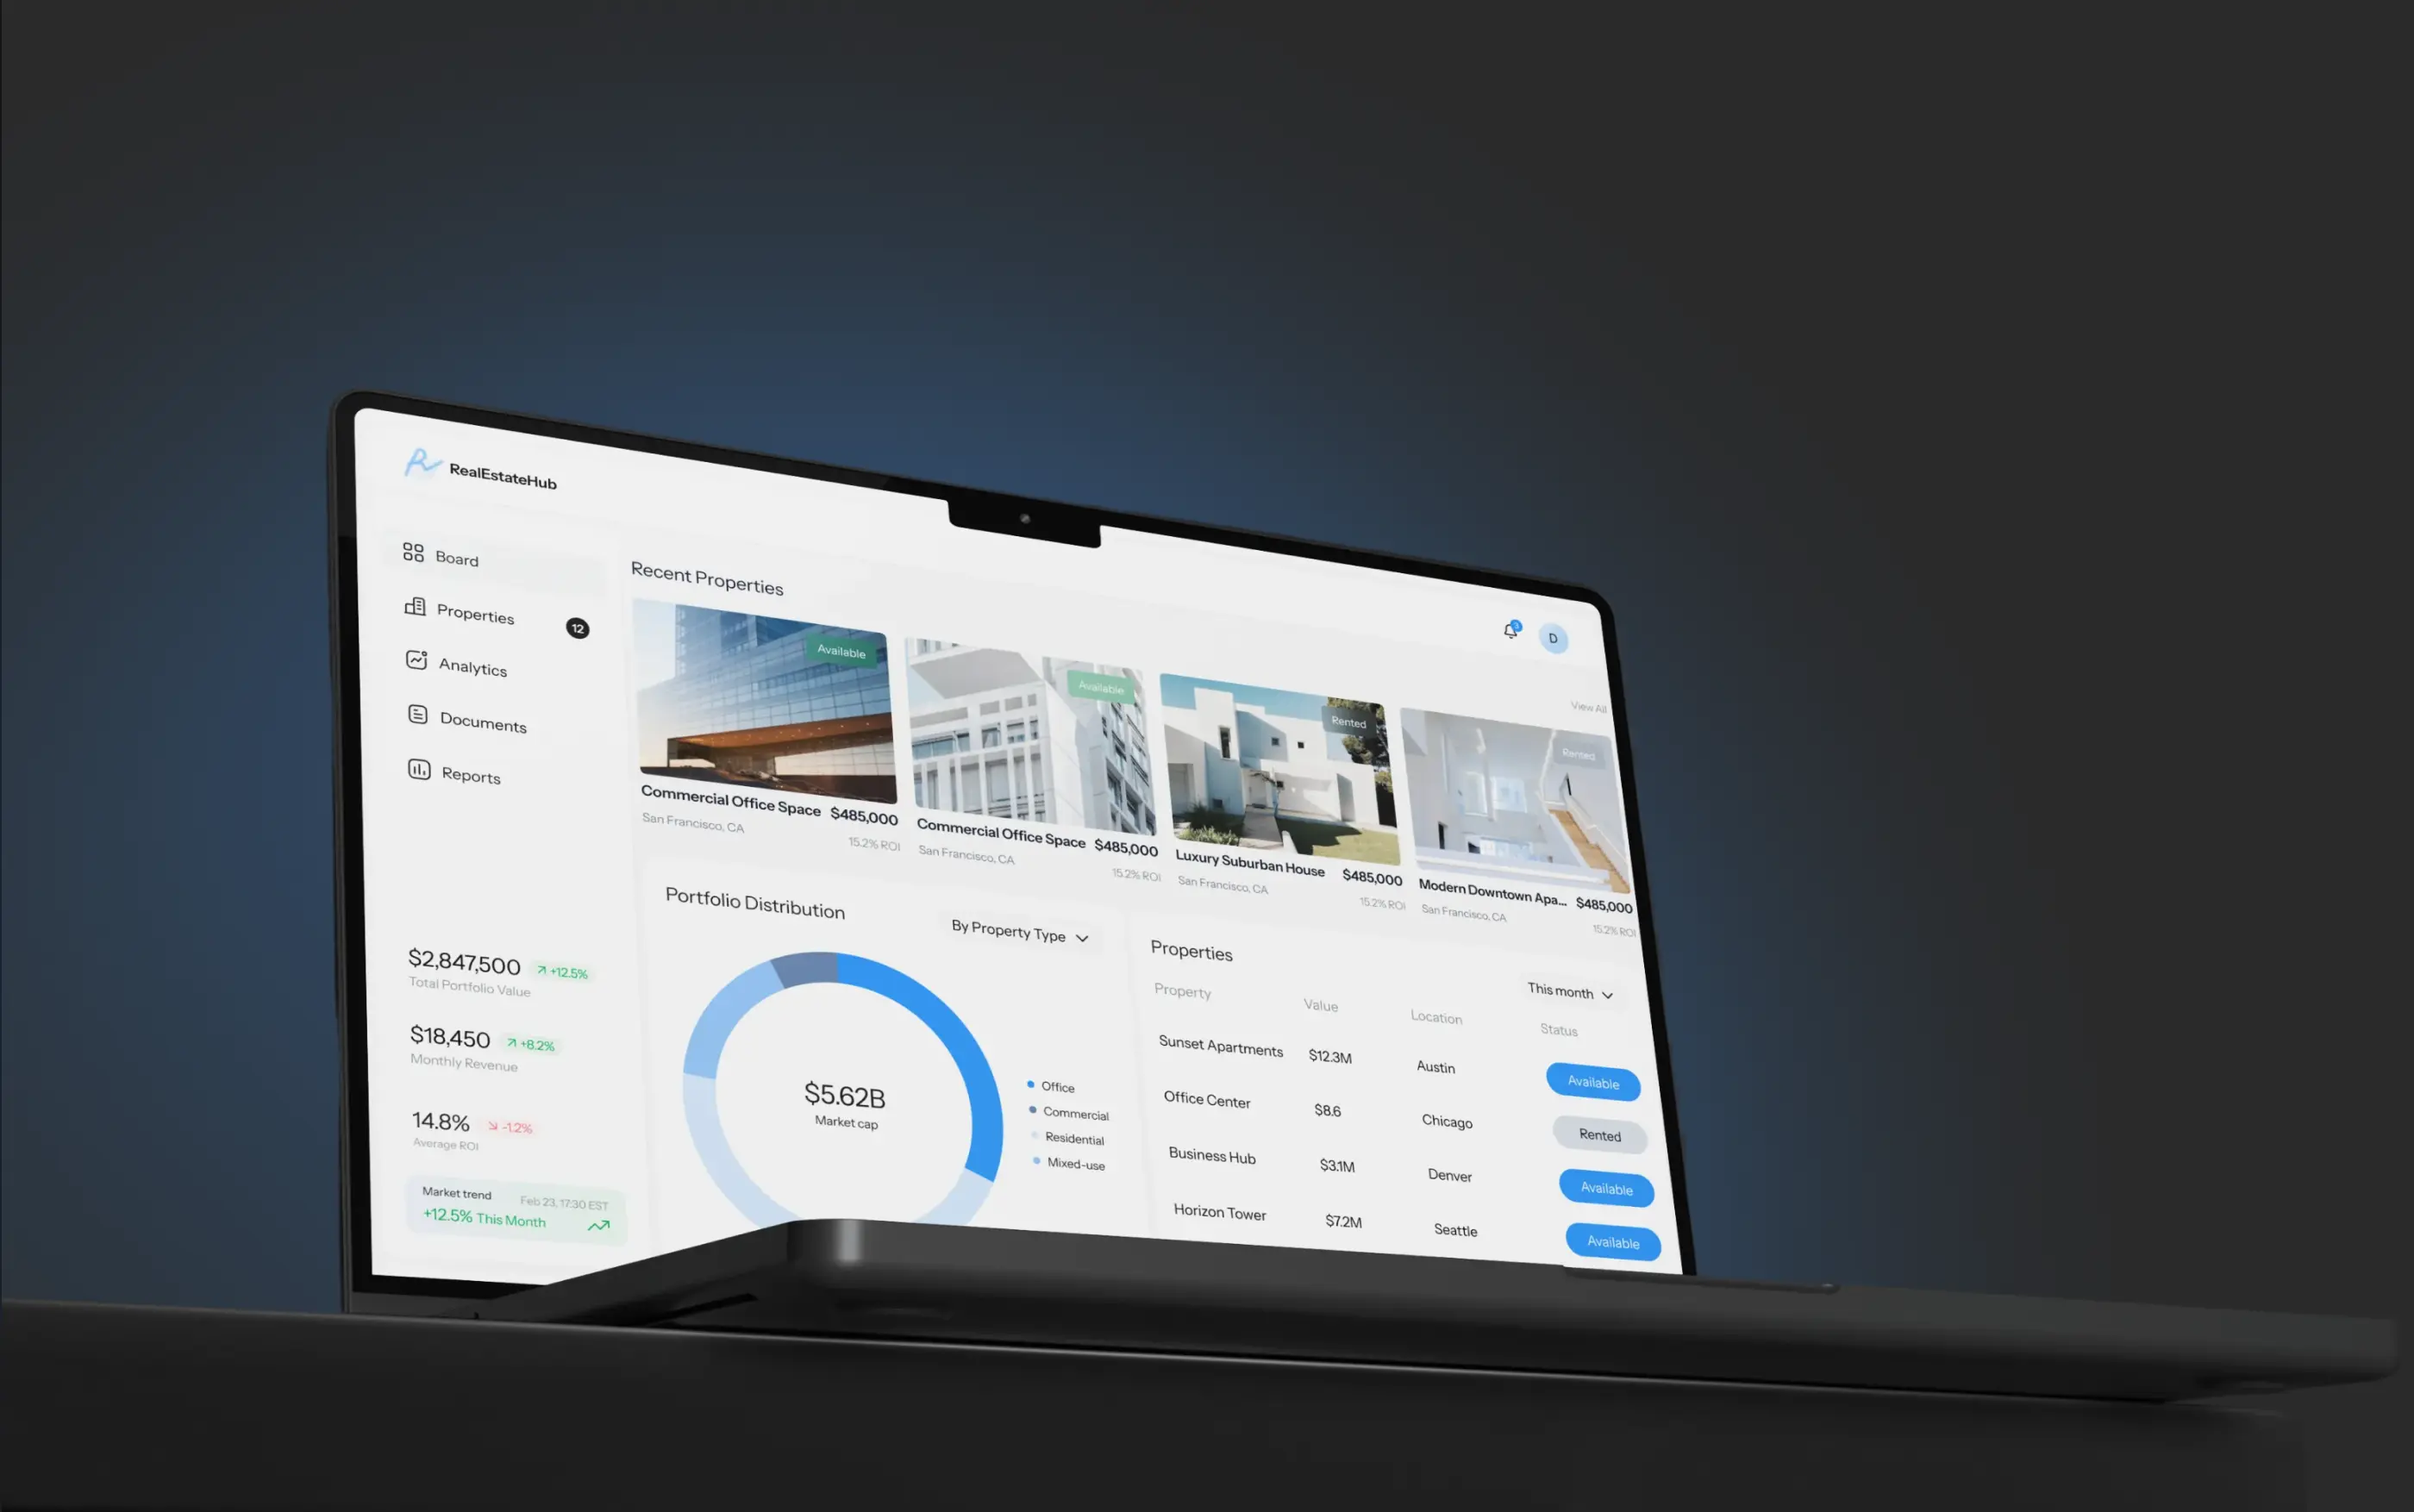
The main colors are soft grays and white for a clean look, with blue highlights for charts and key data points. We keep the layout simple and easy to scan, so users can read numbers and spot trends quickly. For text, we use a modern, clear font that shows details well on dashboards.
Interfaces
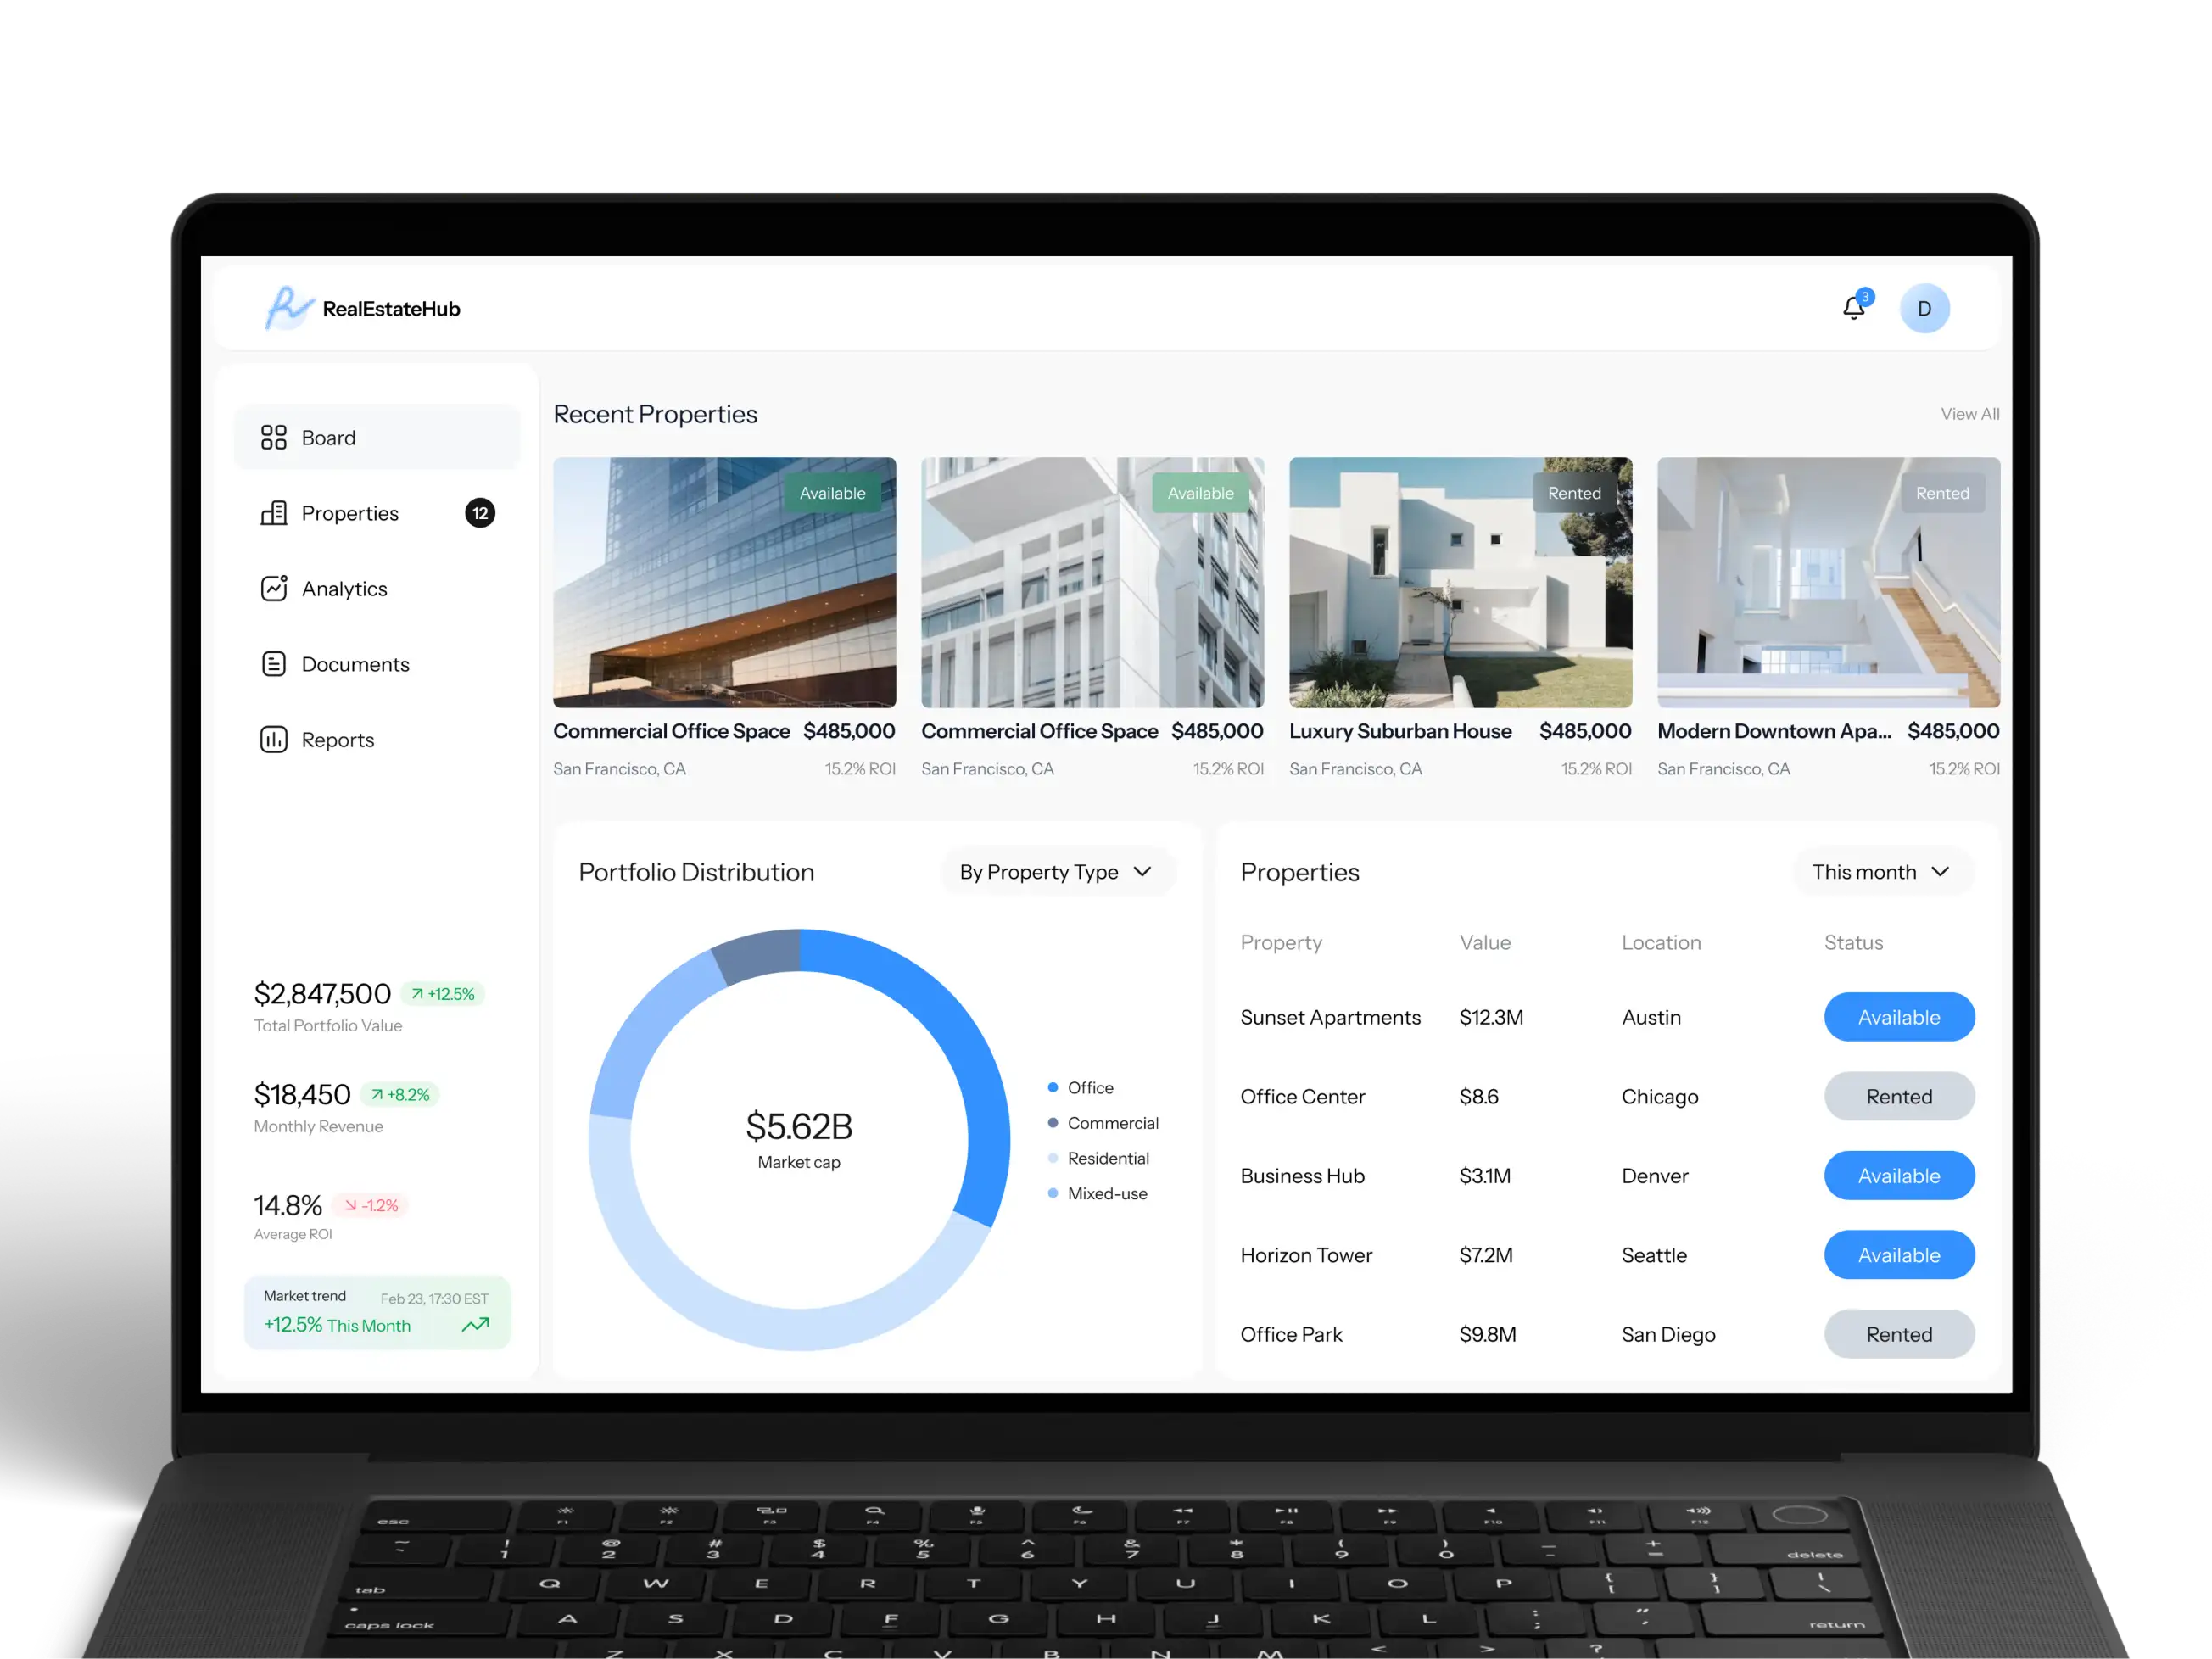
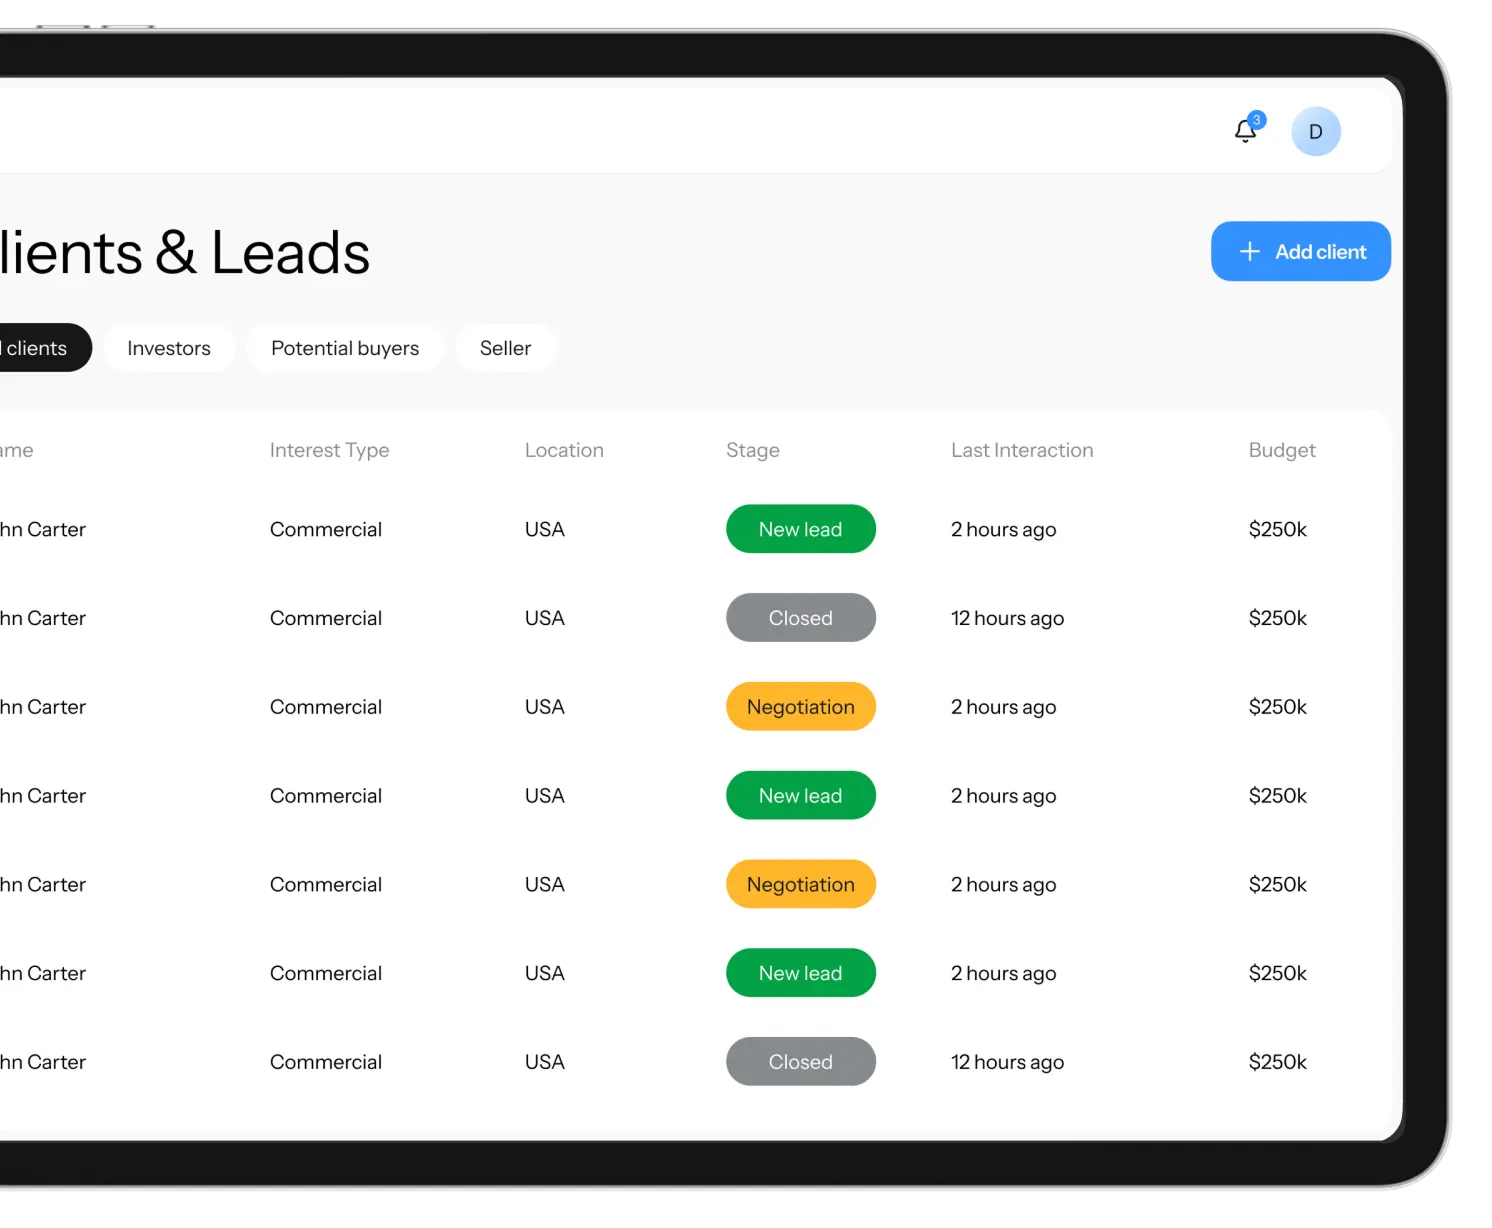
We broke down each section of the platform to make sure users can move around easily. We planned clear paths for checking portfolio performance, looking at property details, managing client info, keeping documents safe, and making custom reports. Each user role gets access to the tools and data they need.
UI kit
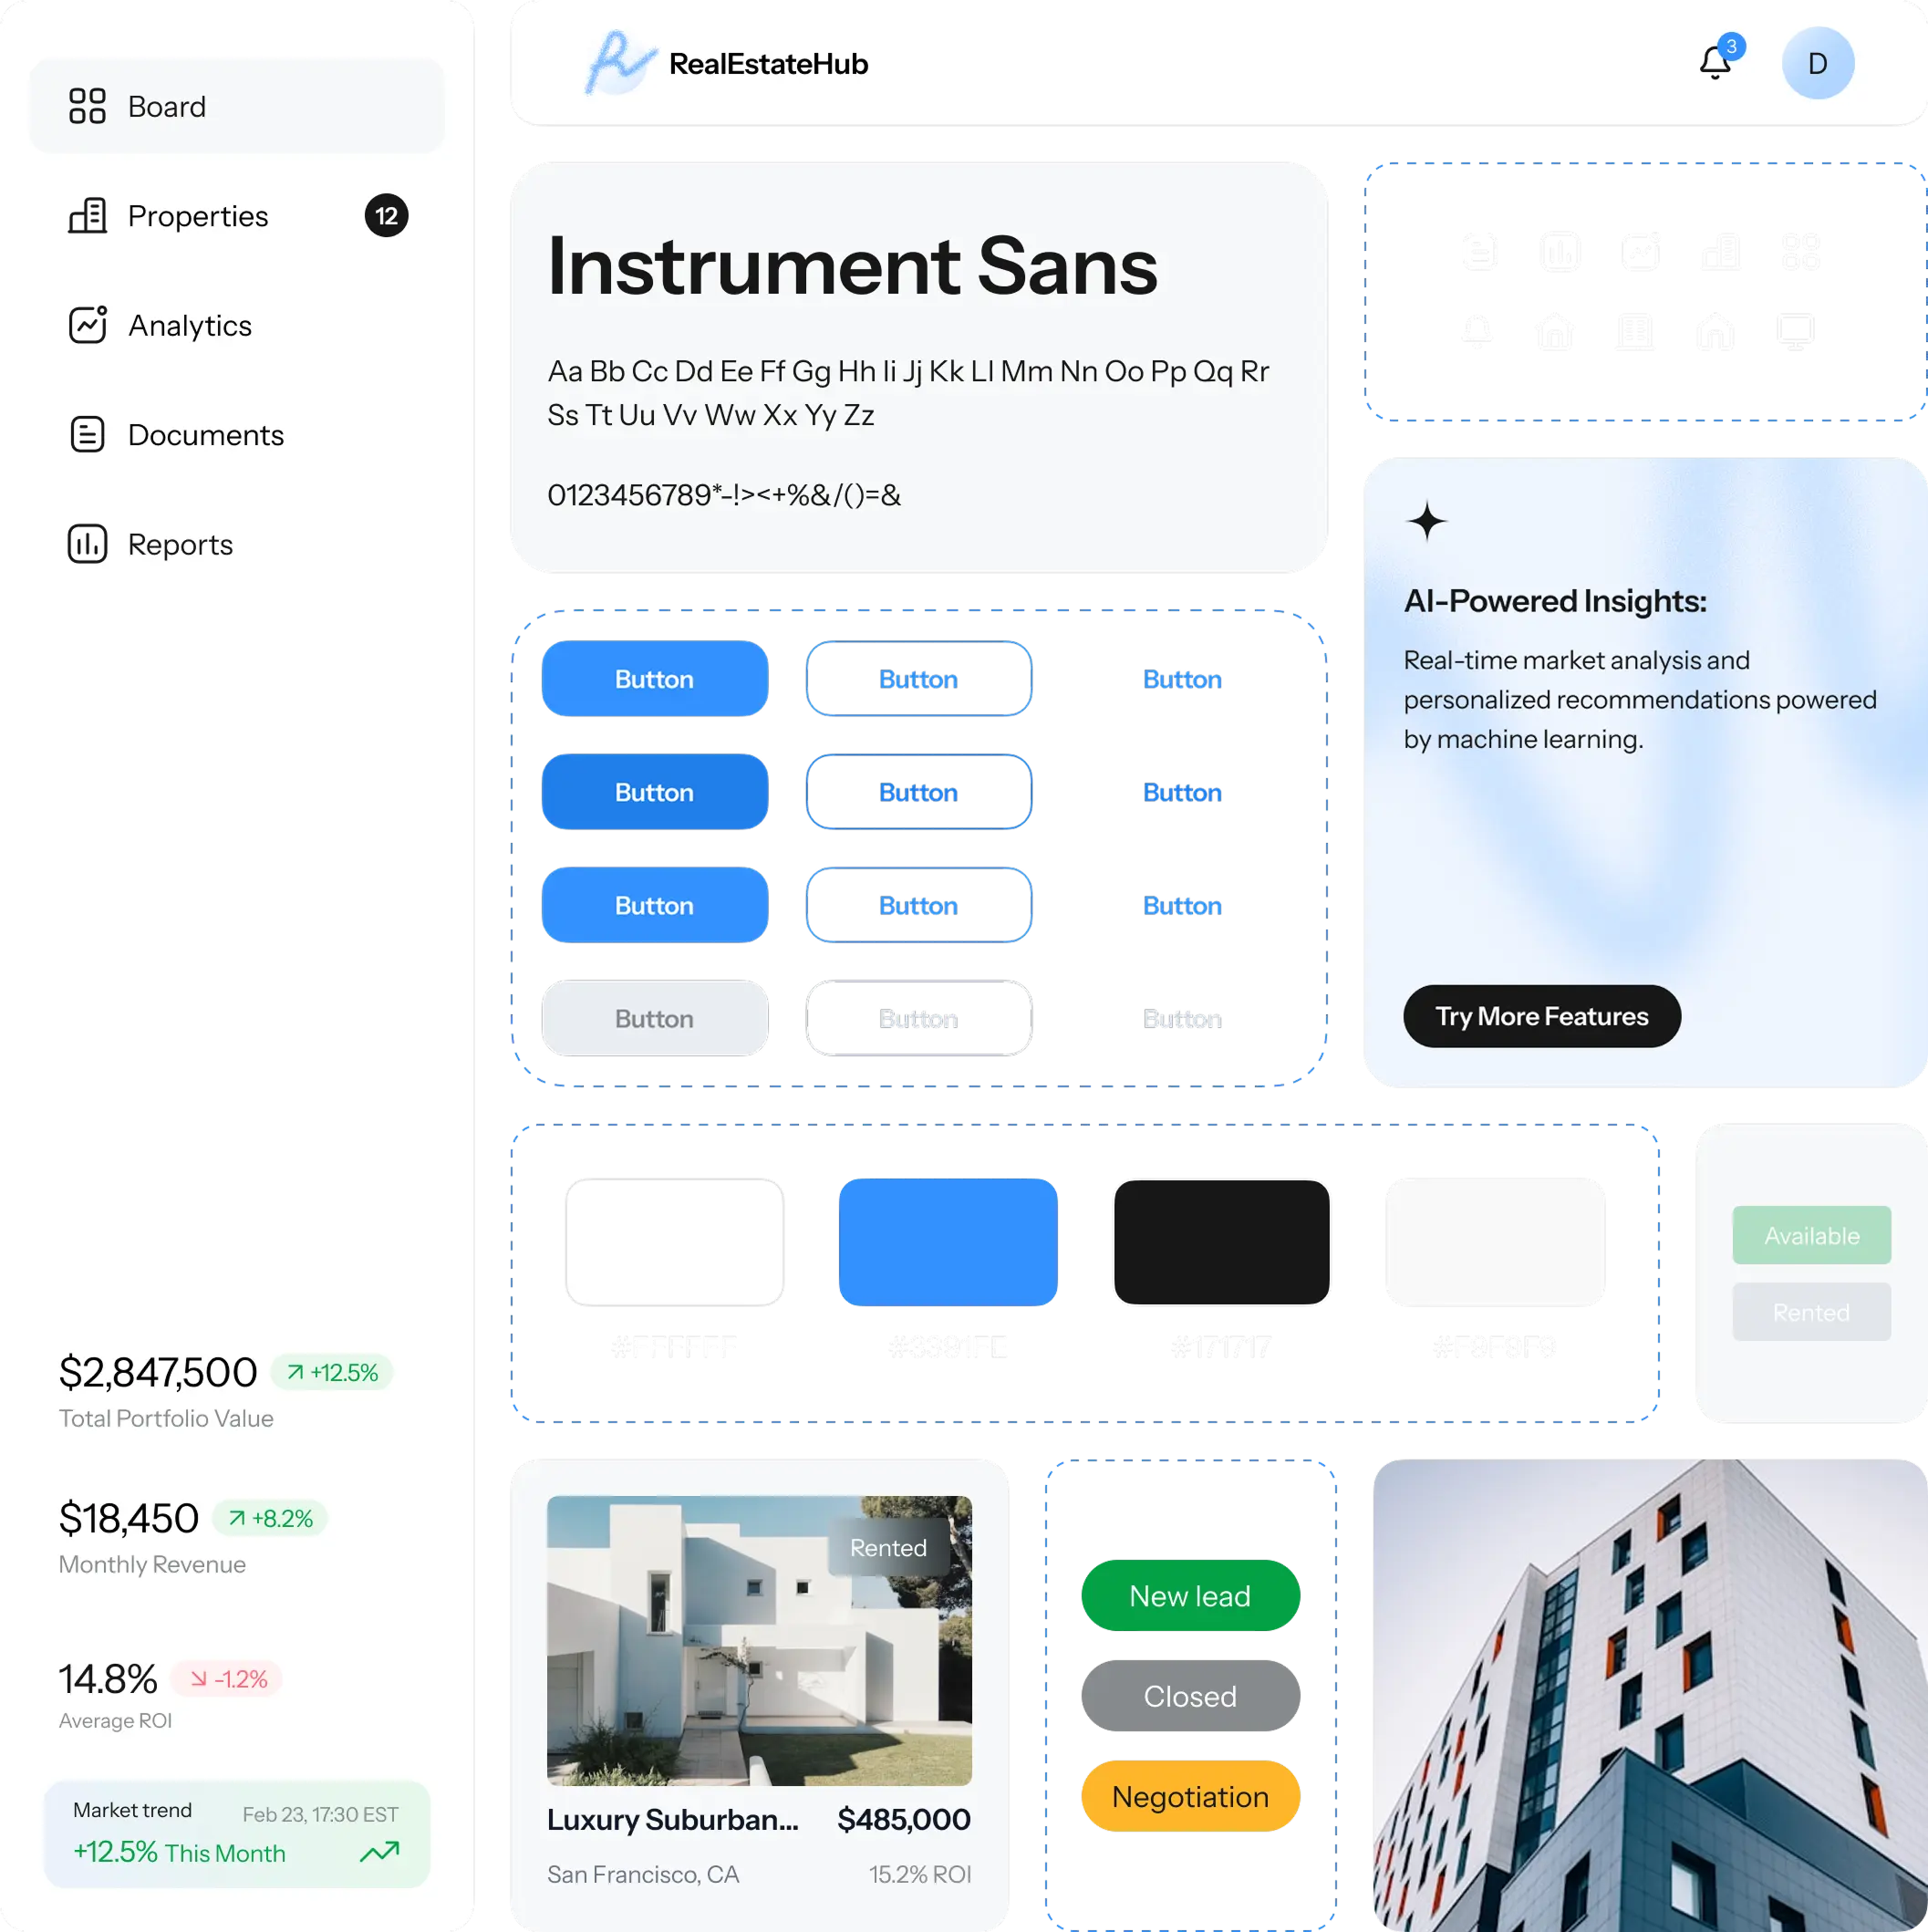
We also made a UI kit with all design elements, so future updates and new features will look consistent and be easy to build. The kit uses Next.js components to help the platform grow smoothly.
Key features
Investment dashboards
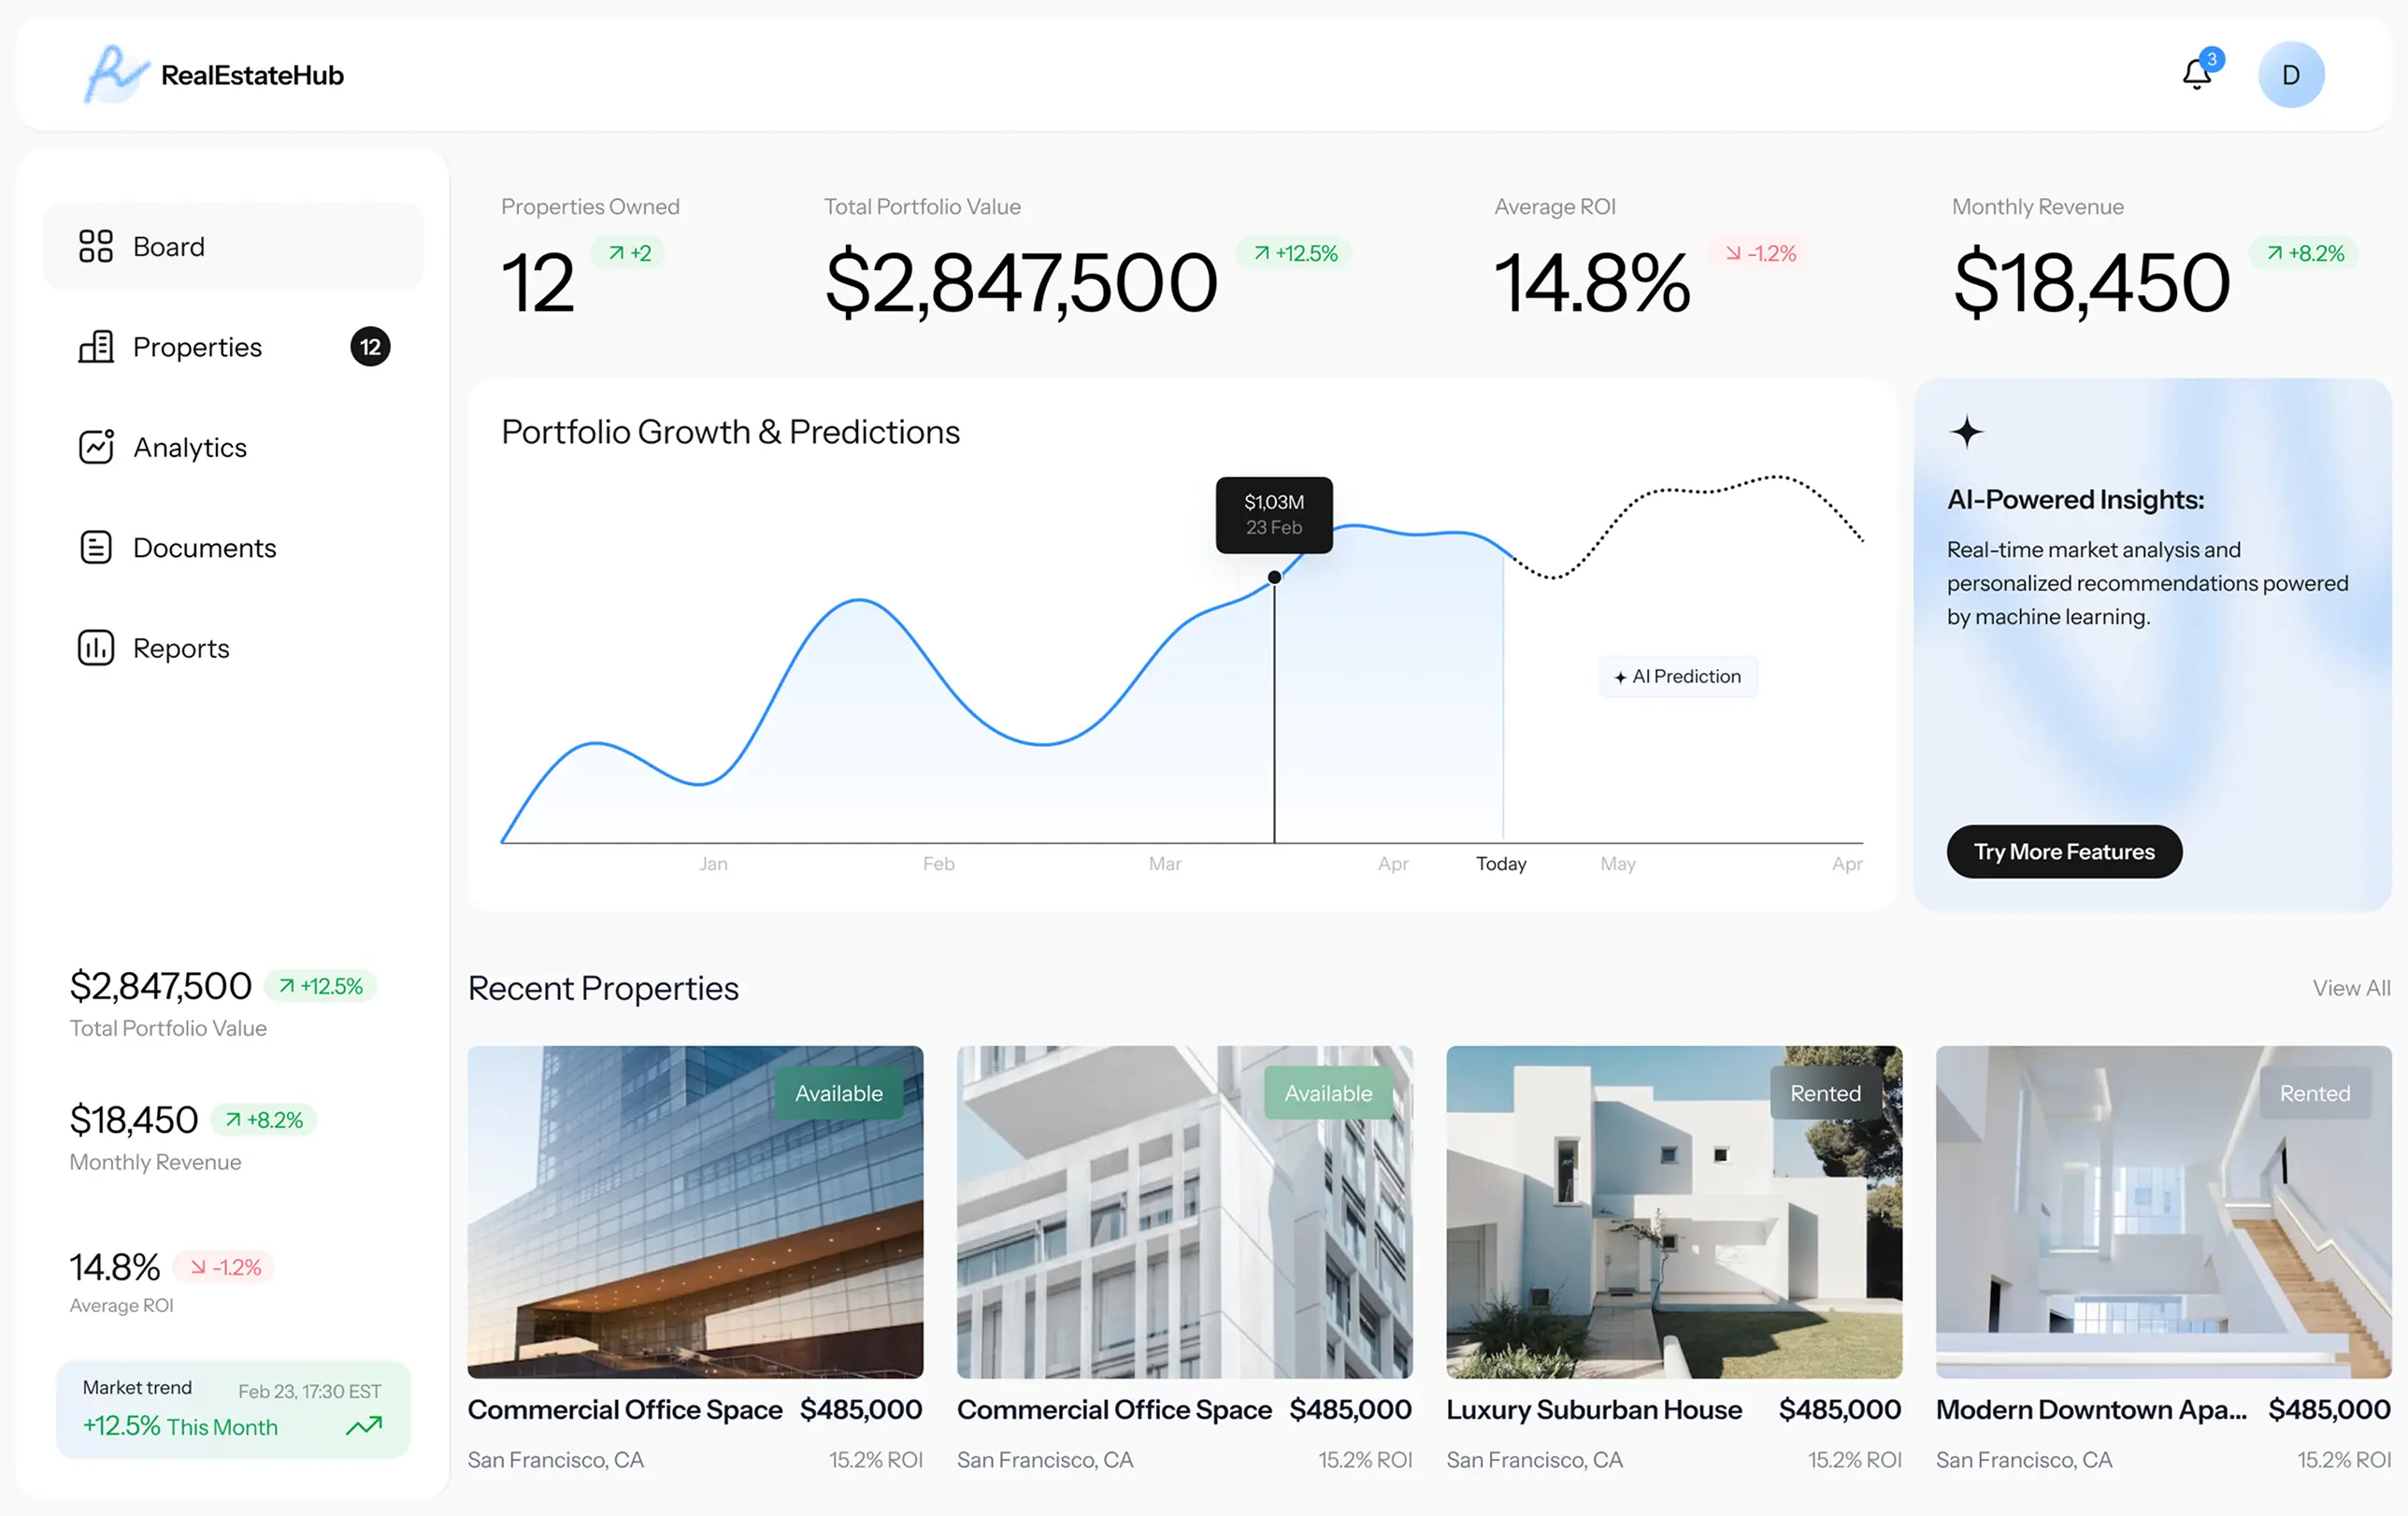
Users can see real-time updates on their investments, market trends, portfolio value, and new opportunities


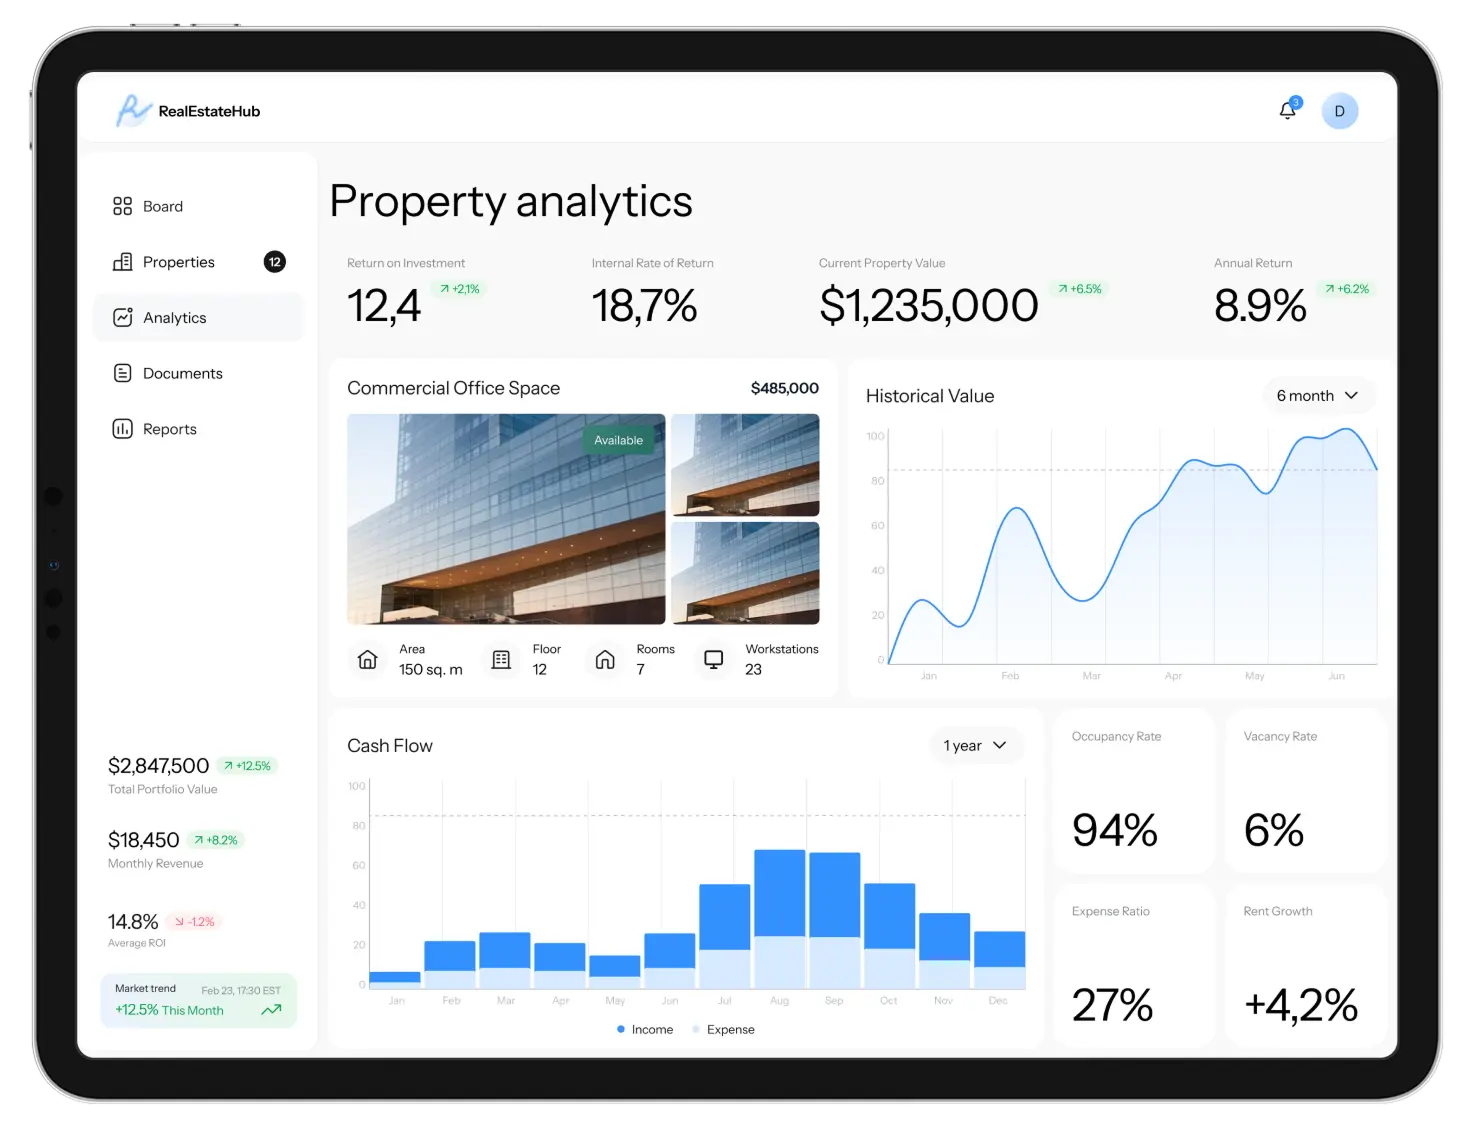
Property analytics
Users can review detailed property data, look at past performance, run predictions, and check return on investment.
CRM tools
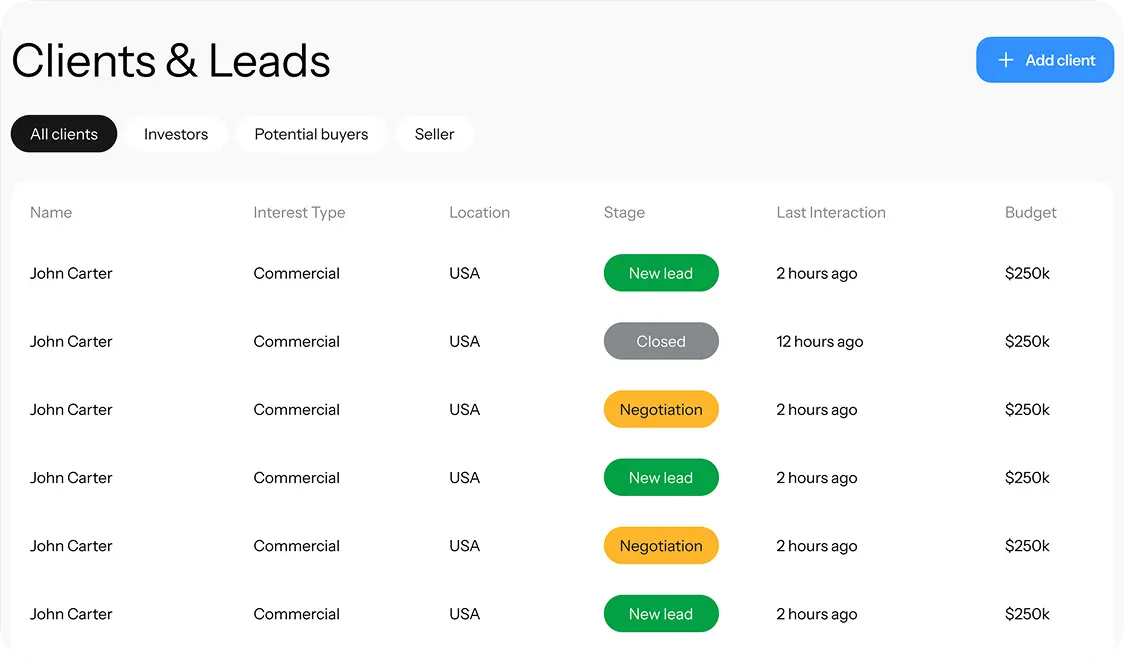
The CRM module allows to track client interactions, manage leads, and automate communication workflows.
Document management
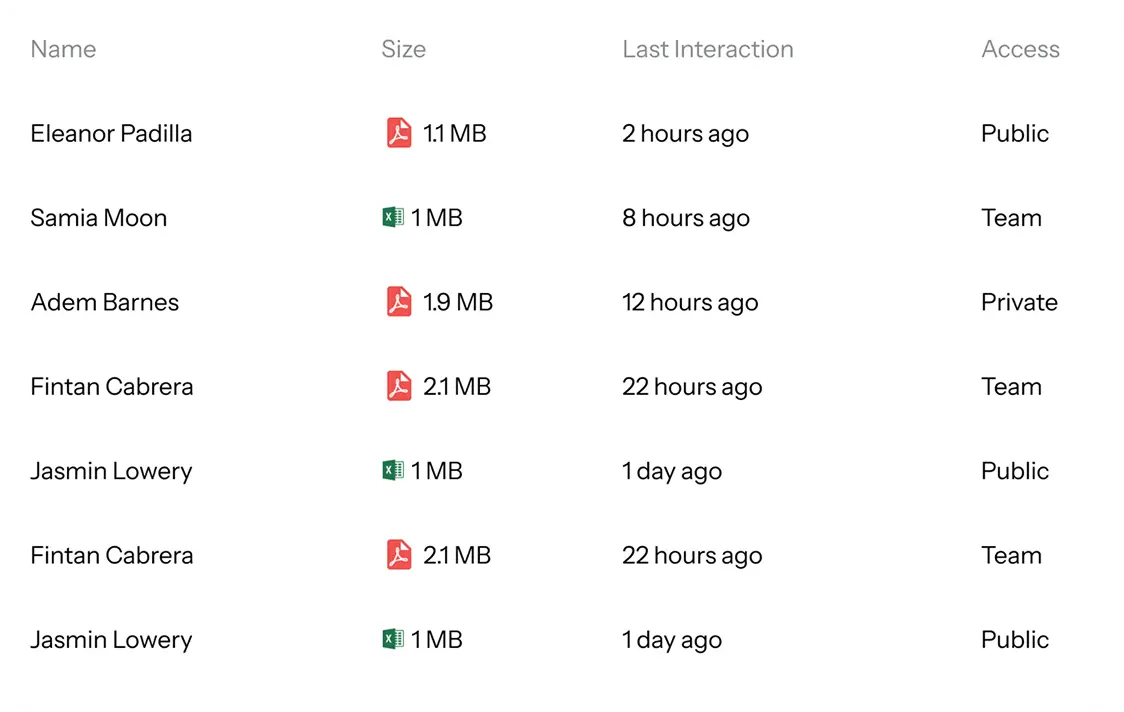
Users can store and organize all property documents securely, with the ability to see document history and set who can access each file.
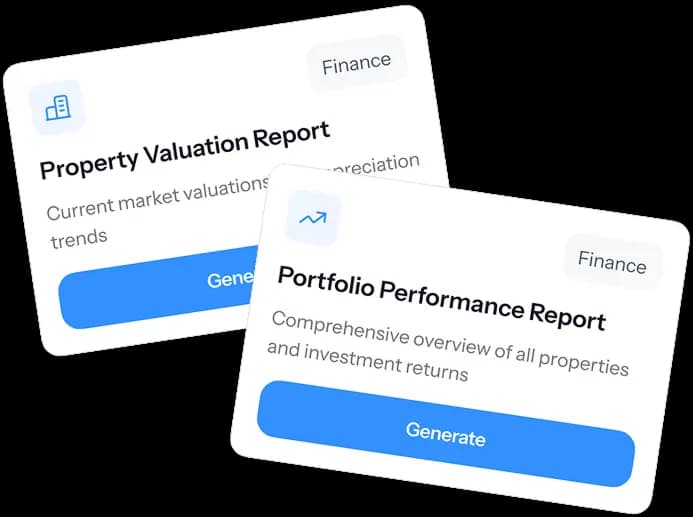
Reporting tools
These tools allow users to create custom reports on investments, market details, finances, and compliance, and download them in different formats.
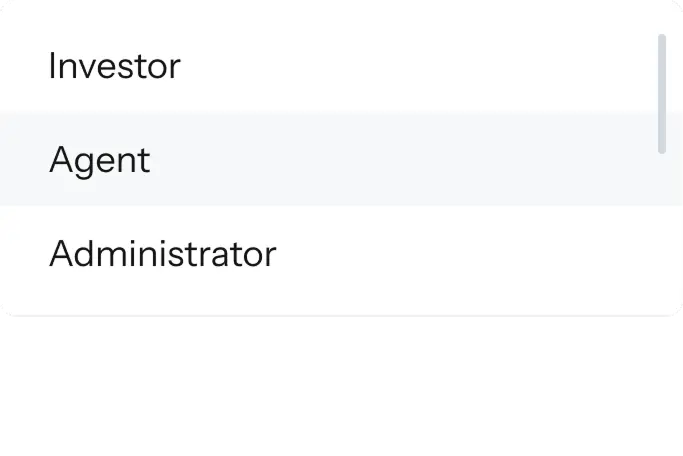
Access control
Granular access control allows different user types to access specific functionalities and data securely.
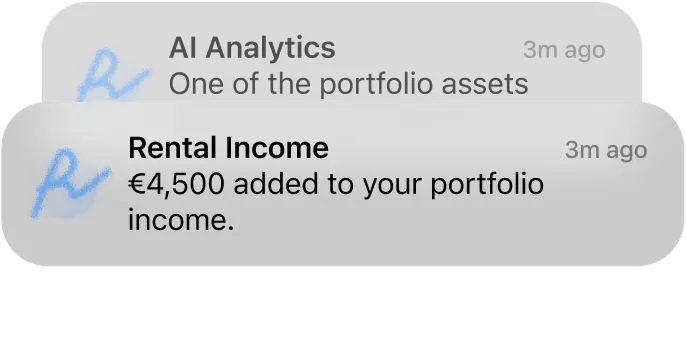
Notifications
Users get alerts about market changes, property updates, lease renewals, and important financial events.
Killer feature
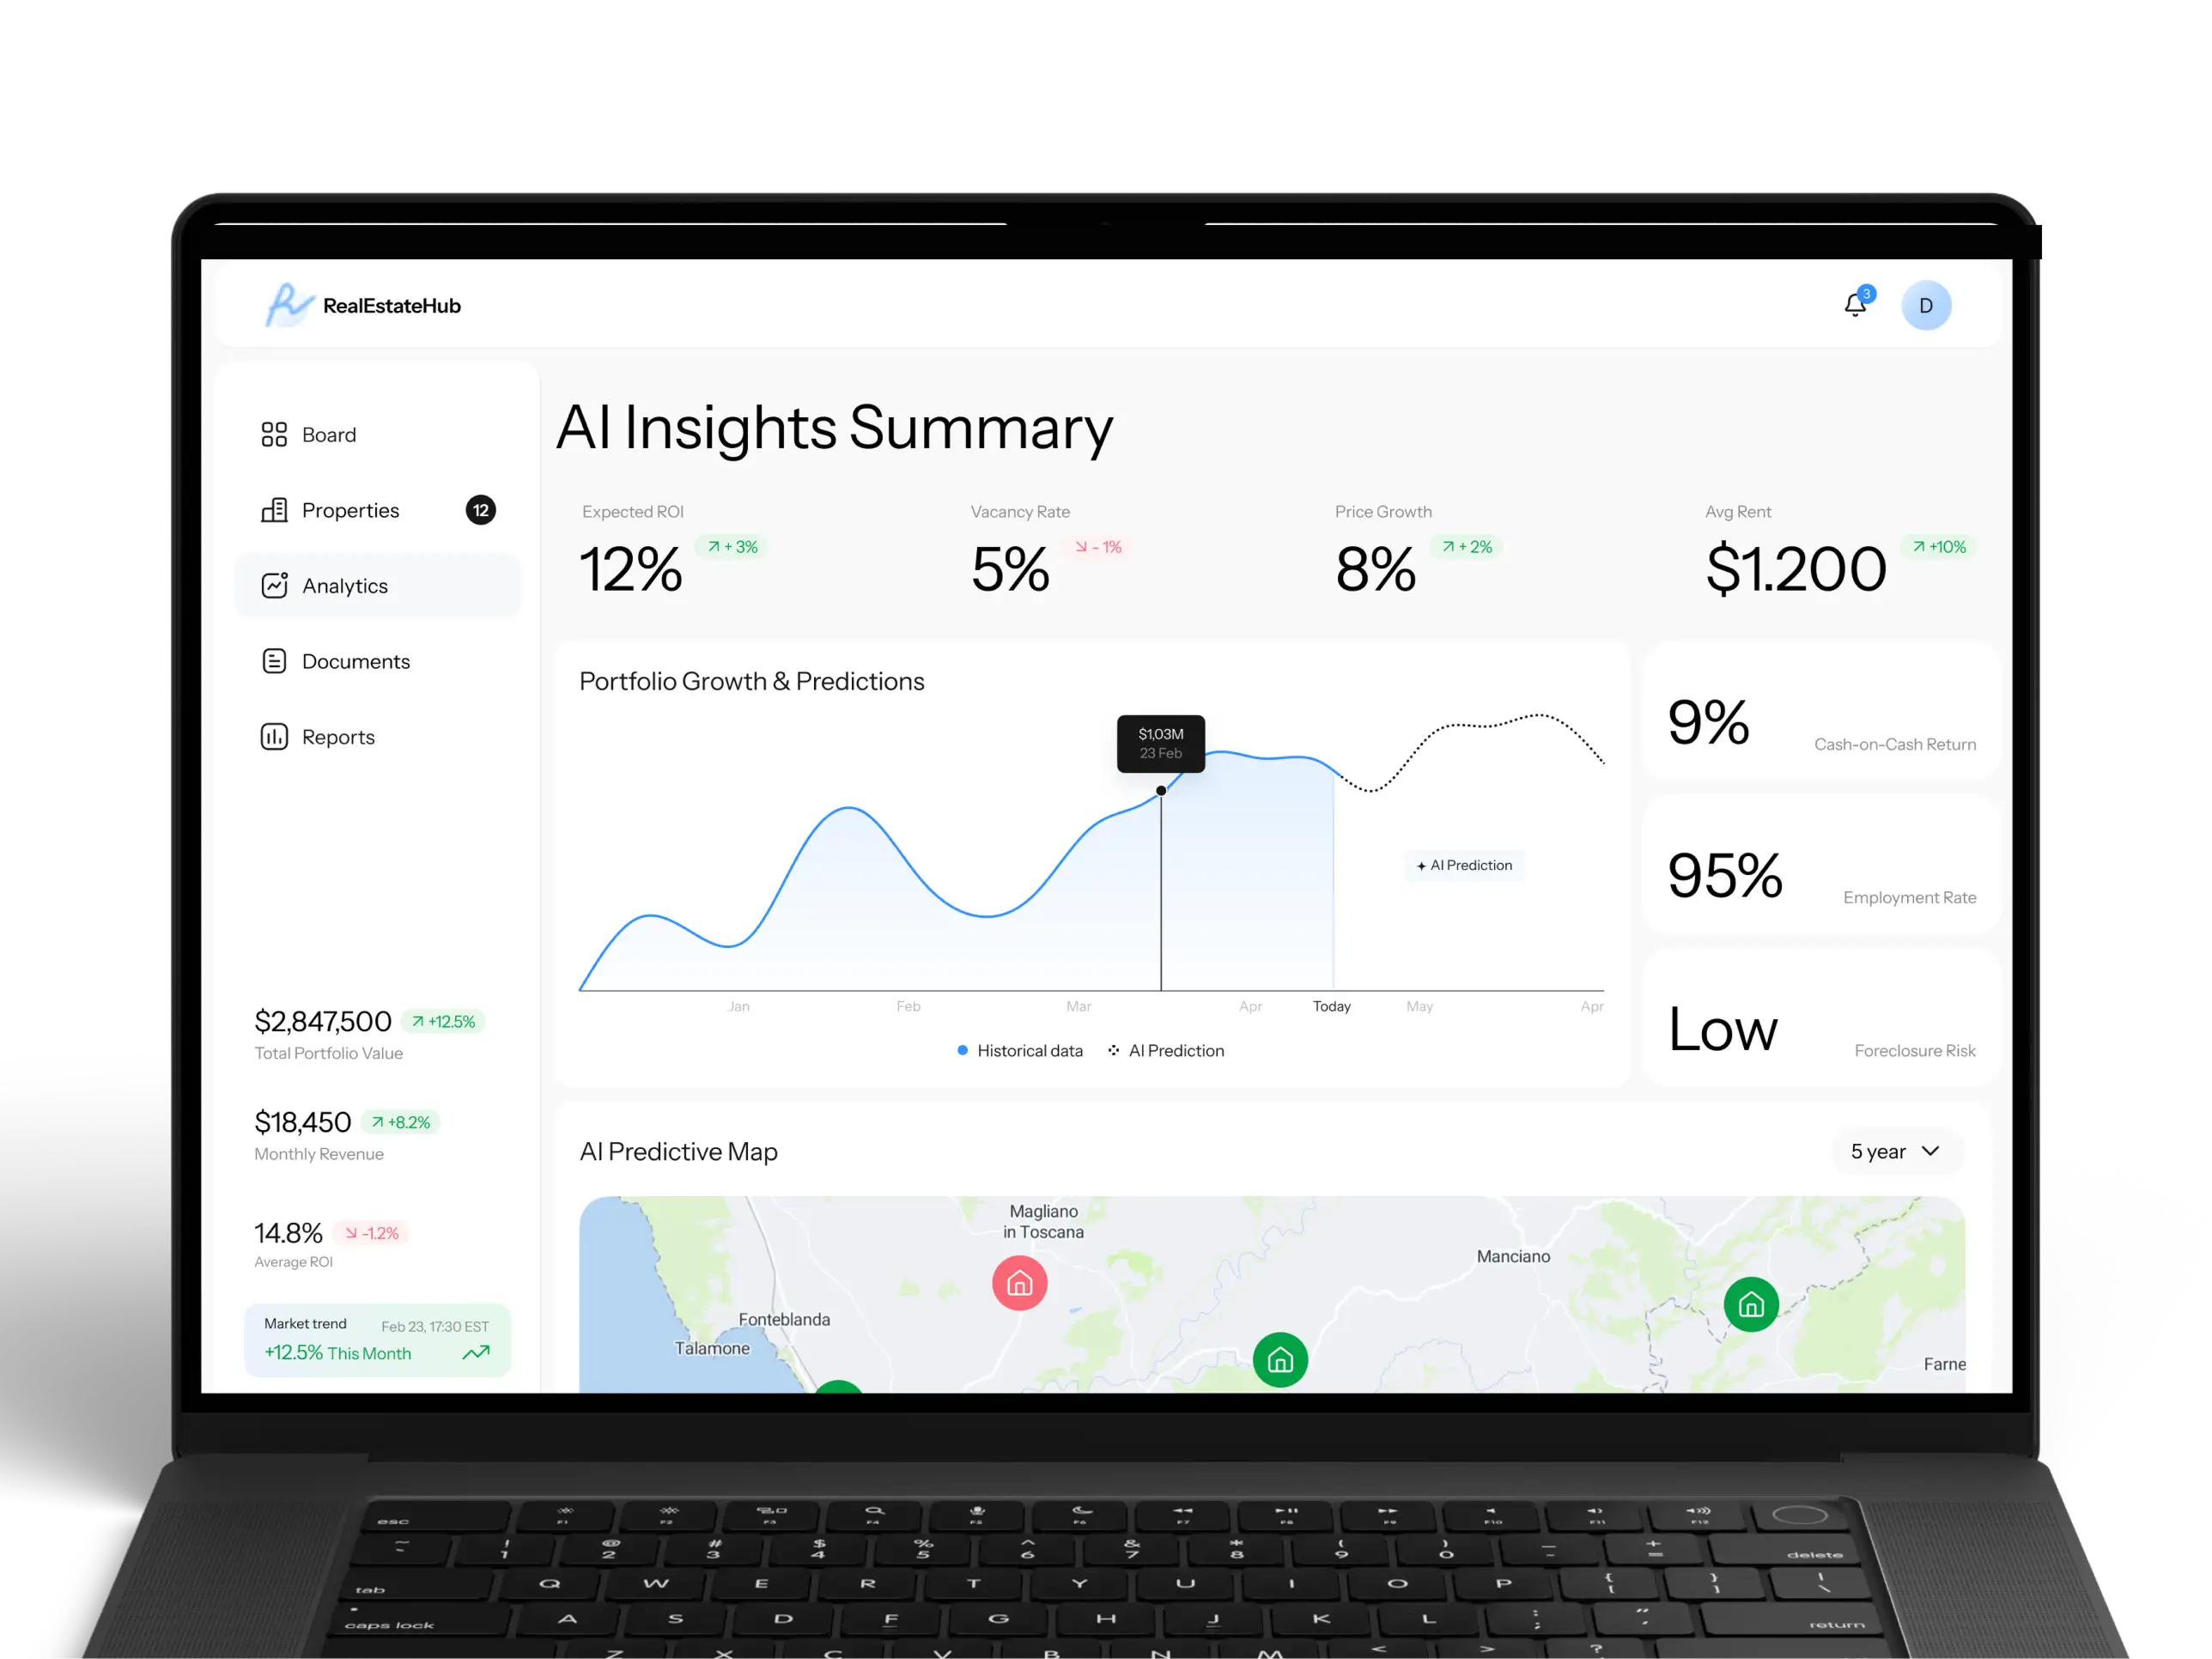
AI-driven predictive market analytics
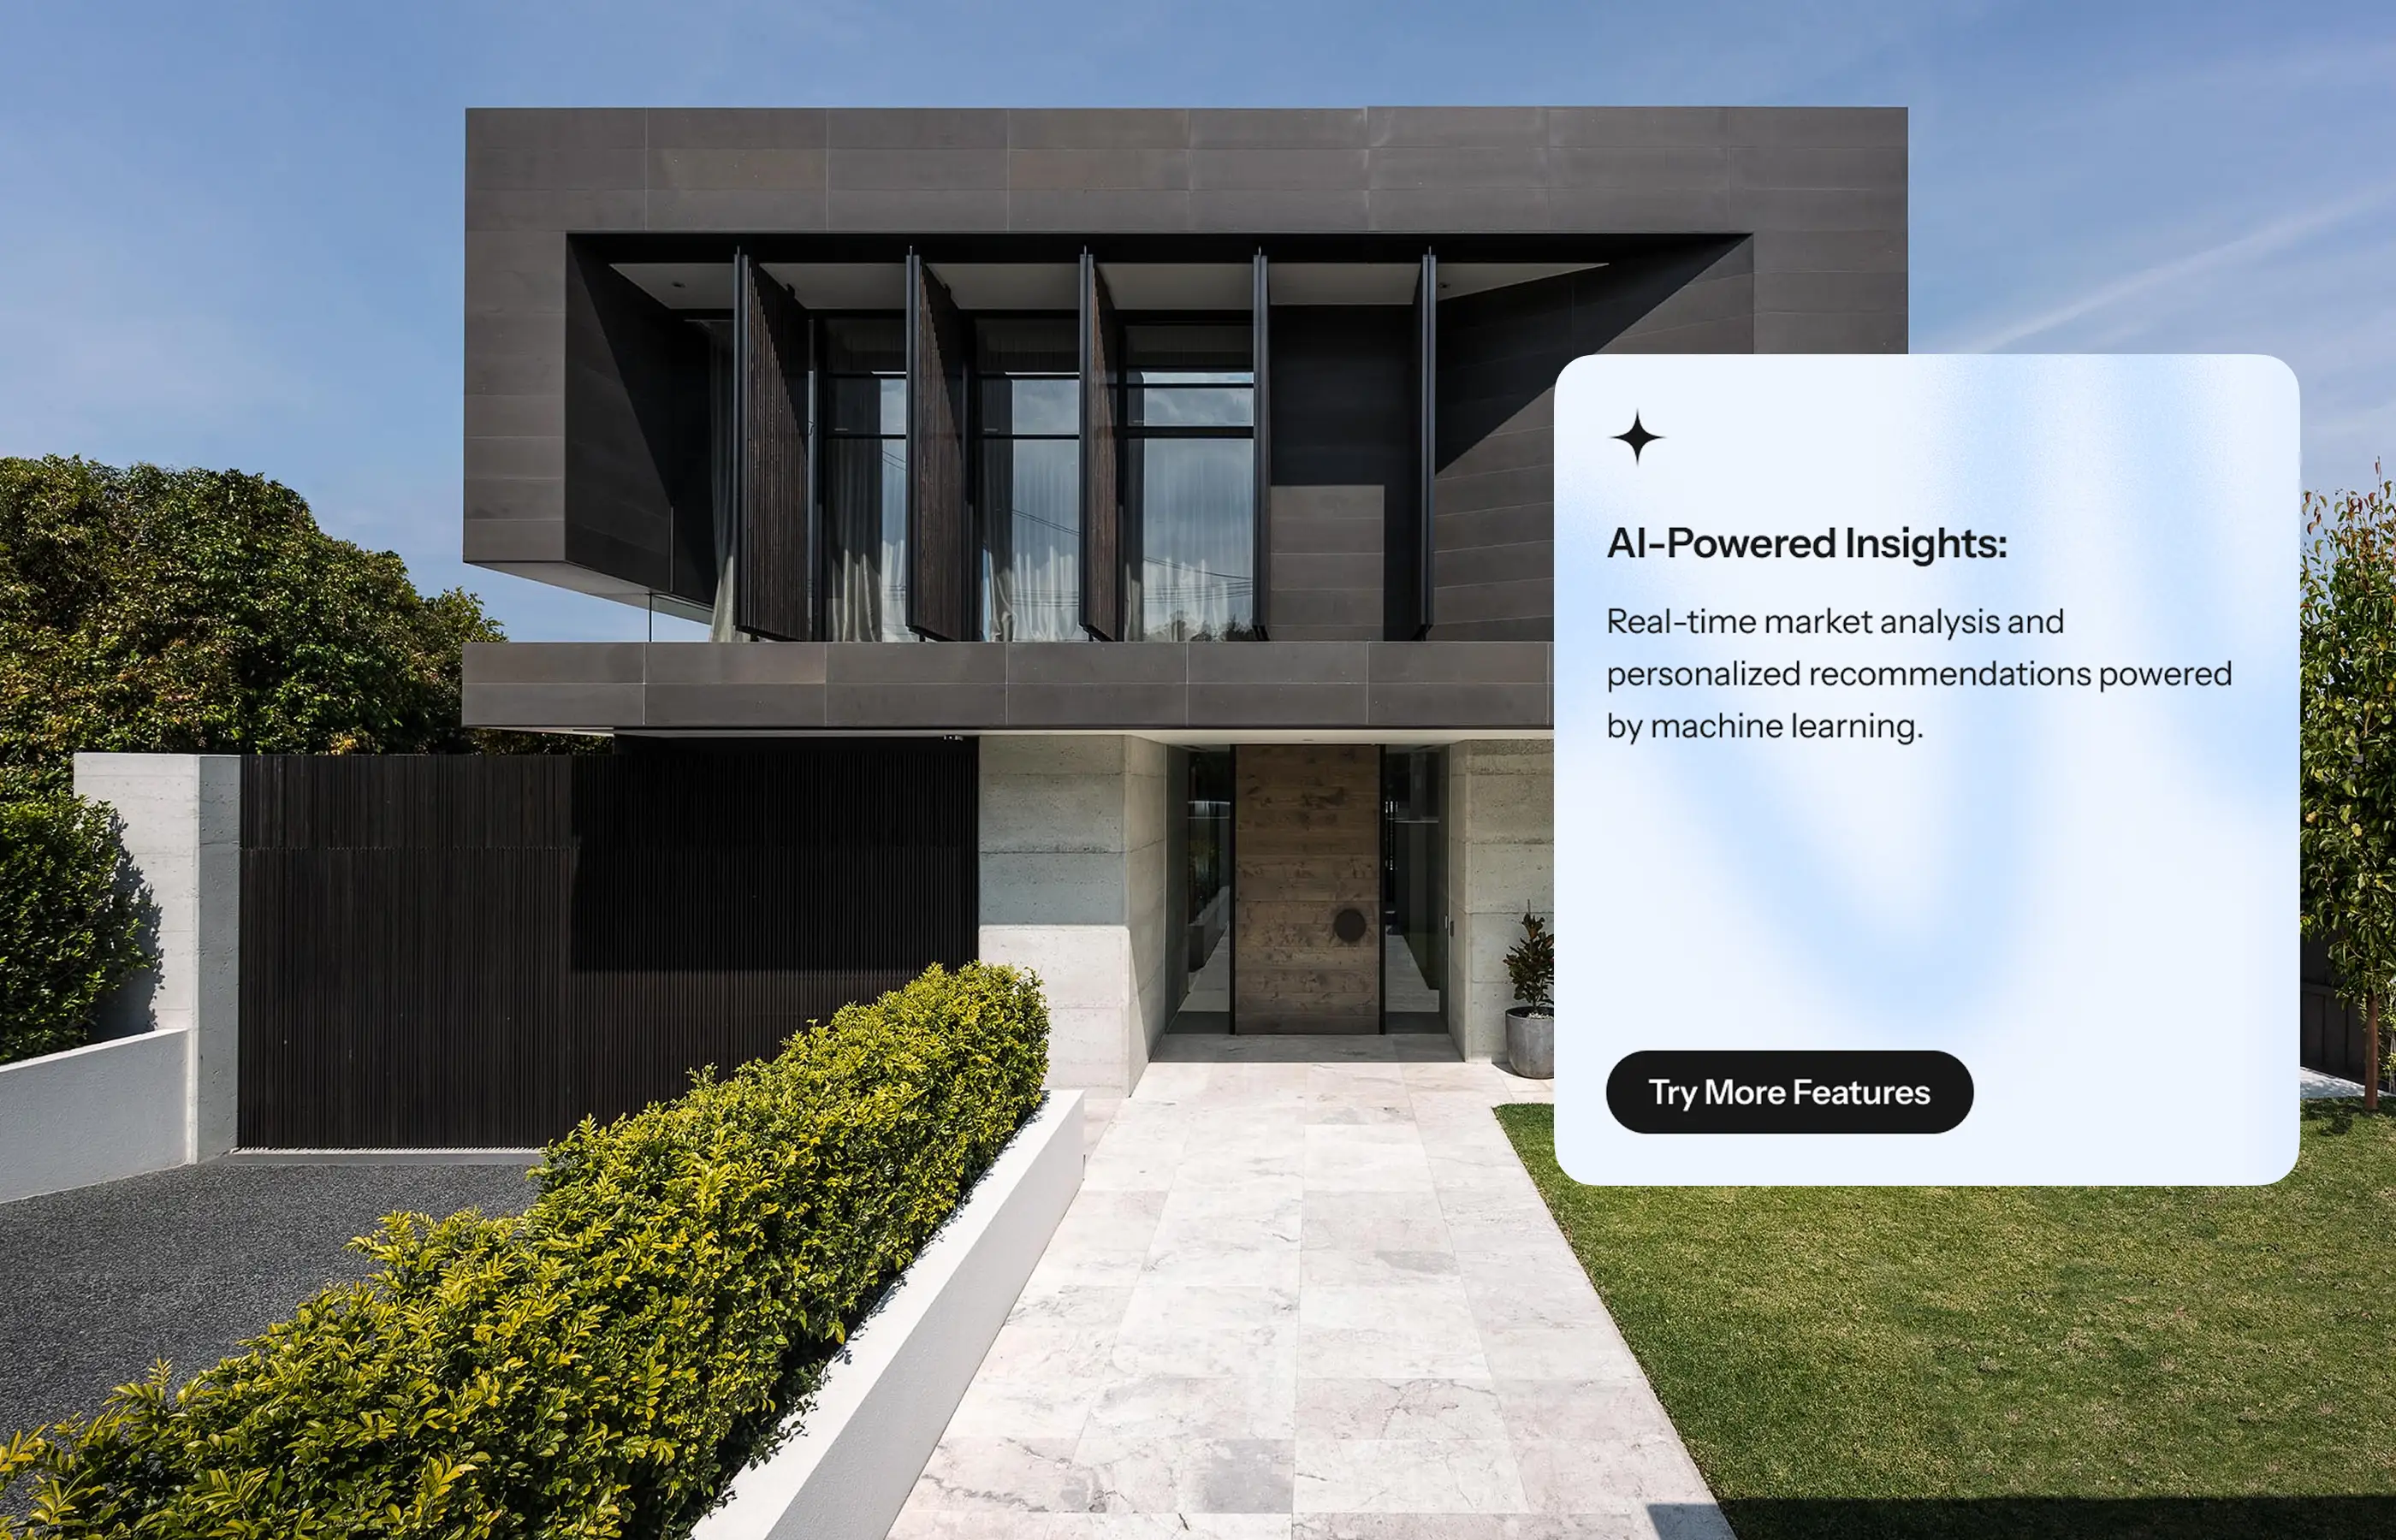
We integrated several AI models to process vast amounts of market data, demographic trends, and economic indicators to provide predictive insights into property performance and emerging investment opportunities. With AI-driven market analytics, users can make smarter, faster decisions based on real data trends, which helps them invest with more confidence and reduces risk.
Development
Our development approach was focused on building a highly performant, secure, and modular web application capable of handling large volumes of data and complex business logic.
Frontend
We chose Next.js for the frontend to create dynamic, interactive dashboards and user interfaces. This makes data viewing and management smooth and reliable, while also delivering excellent performance and strong SEO, so the platform loads quickly and is easy to find online.
Backend
For the backend, we used Laravel to handle data processing, user logins, and connections to outside data sources. Laravel’s strong framework helps keep the platform secure and efficient.
Database
We picked PostgreSQL for the database because it’s dependable and scales easily. It also handles complex real estate data like property details, financial information, and user profiles without trouble.
Admin panel
An advanced custom admin panel, built efficiently with Laravel Nova, provides system administrators with granular control over users, property listings, market data feeds, and compliance settings.
Integrations
Stripe for secure financial transactions.
Mapbox for geographical data visualization and location-based analysis.
Zillow API for real-time market trends, property valuations, and investment insights.
Salesforce CRM for seamless lead and client management, integrated via APIs.
Docu Sign for contracts, leases, and legal documents.
Metabase for advanced data analytics and custom report generation.
Challenges we faced
One main challenge was bringing together different types of data — property listings, market trends, and financial records — into one clear analytics system. We also needed to make sure data updates in real time, stays secure, and follows financial rules. To solve this, we built a strong data pipeline with Laravel, added advanced encryption and user access controls, and used Next.js to show data quickly and smoothly on the frontend.
Results
The platform launched successfully and gave our client a powerful tool to work more efficiently and make better decisions. It led to a reduction in manual data processing and faster real estate investment analysis. The client continues to partner with us for ongoing development and the integration of new features.

