Dashboard design services: what you get, how the work runs, and what it costs


A dashboard designer turns the numbers a team needs into screens people can read and act on. At Ronas IT, designing the dashboard of a new product starts from $2,000, and the estimate grows with the views and roles the dashboard has. In this work, the designer finds out who uses the dashboard and for which decisions, picks the numbers each view shows, and designs the layout, the charts, the filters, and every state of the screen.
This guide is for founders and product owners who plan a dashboard inside a SaaS product or an internal one for their staff, and want to know what to ask for before they request quotes. Building the dashboard is a separate budget, which our guide to data visualization services breaks down part by part.
What dashboard design services include
A dashboard design project covers six parts of the work, from the questions the dashboard must answer to the files developers build from. A quote that leaves one of them out is a smaller project. That can be fine, as long as you know which part your team will do instead.
- Users and decisions: who opens the dashboard, how often, and what they decide with it. A support lead who checks queues every hour needs a different screen than a founder who reviews revenue once a week.
- Metrics and data: which metrics each view shows, which system holds each number, and what the number means, such as who counts as an active customer.
- Layout: the order of the blocks on the screen, so the numbers people check every day come first and the details sit one click away.
- Charts and tables: a chart type for each question, and tables that let people sort, filter, and open a record.
- States: what each widget shows while data loads, when there is no data yet, when a source fails, and when a user has no access. Nielsen Norman Group calls empty states opportunities to communicate system status, help people learn the product, and give direct paths to key tasks.
- Handoff: design files with a UI kit, so developers build every screen from the same components instead of copying values from pictures.
Customer dashboard, internal dashboard, or admin panel
Who looks at the dashboard shapes the design work: your customers, your managers and analysts, or your operations staff. Before you ask for quotes, decide which of these three cases yours is, because each one puts the design effort in a different place.
| Dashboard | Who uses it | What the design must get right |
|---|---|---|
| A dashboard inside your SaaS product | Your customers | The first visit with no data yet, your brand on every screen, and settings each customer can change without help |
| An internal dashboard | Managers and analysts in your company | Many metrics without clutter, filters by team, region, or period, and exports |
| An admin panel | Operations staff and administrators | Tables of records, actions on those records, and different rights for each role |
An internal system with several roles has its own rules for tables, bulk actions, and role-based views. Our guide to enterprise UX design covers them in depth.
“When a product needs both a dashboard for customers and an admin panel for the team that runs it, I design them as two separate interfaces, even when they read the same data and use the same components. Customers and staff come with different questions, and a screen that tries to answer both is hard for each group to use.”
Alexander Kontsevoy, Art Director at Ronas IT
What you get at the end of the design work
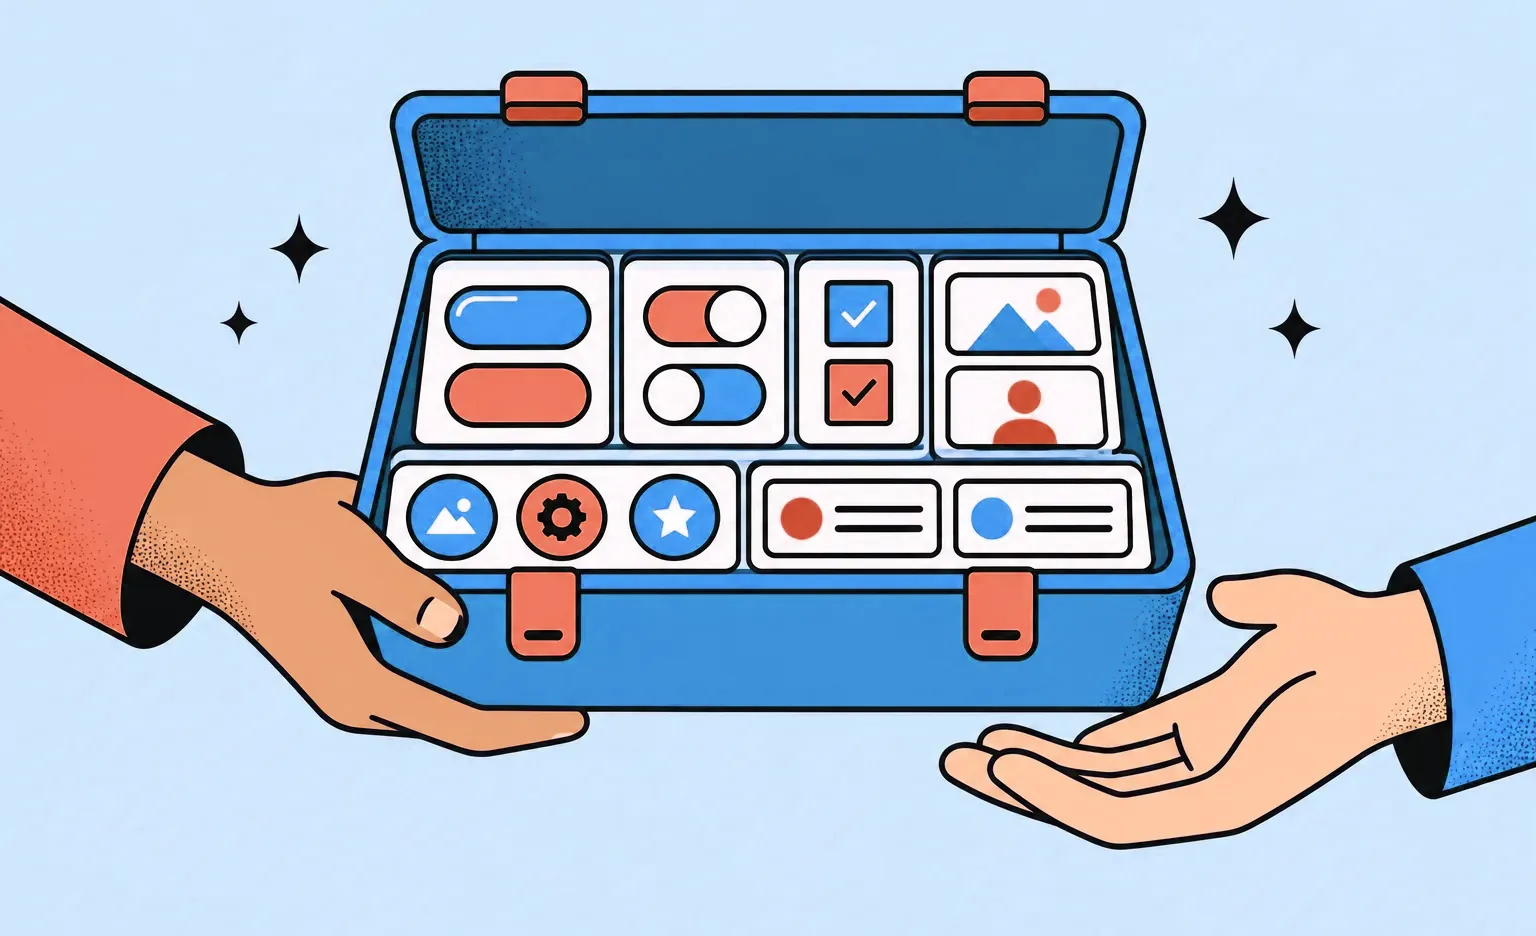
You get a design file your developers can build from without a meeting for every screen. With us, it holds five things, and it is worth asking any team whether its handoff includes each of them.
- Screens for each main flow: each flow drawn screen by screen, with the tablet or mobile version placed next to the desktop one, so developers see what changes with the screen size.
- States: every state of the screens and elements in each feature, such as a form with its error and success messages.
- A UI kit: the components of the dashboard with all their states, plus a table of the variables that developers repeat in the code: colors, type, and the grid. Our guide to design system services explains how a UI kit reaches the code.
- A note for each feature: a short description, a link to its task, and its status, such as in review or ready for development, so anyone who opens the file can follow the logic.
- A style rules file for AI coding tools: a DESIGN.md file in the repository that describes the dashboard's styles, so the AI agents your developers use build new widgets and views that match the design.
How a dashboard design project works, step by step
The work moves from people and decisions to metrics, a visual concept, and a map of the views, and only then to the final screens. At Ronas IT, we design in sprints, usually one to three weeks long, and after each sprint you can open the new mockups.
- Your brief: who will use the dashboard, the decisions it supports, which systems hold the data, and the reports or spreadsheets people use today.
- Analysis, if needed: when the metrics or data sources are not clear yet, the analysis phase sets the scope. It ends with user stories, flow maps, and a scope document with a budget and a timeline.
- Metrics for each view: the designer makes one metrics list per role, with the source of each number.
- Visual concept: the designer styles a few key views, so you agree on the colors, fonts, and look of the charts before the full design starts.
- Product map: a diagram of every view and widget for each role, the data each widget needs, and the links between views, so the exact scope is agreed before the screens are drawn.
- Final UI and states: the designer draws the final screens, their states, and the UI kit in logical parts, starting from a copy of our design system. The designer checks each part against our quality checklist, and another designer reviews it before you see it. In Figma, each of our designers works alongside an AI agent linked to the design file, which it reads and edits on request. With the agent, the designer builds the widget components, sets up the type scale for numbers and labels, assembles the UI kit, and works through the path from an alert to its detail view. The designer directs each step and decides what every widget shows and how its states read.
- Prototype: every design file gets at least a minimal prototype, with headers and filters that stay in place and tables that scroll as they will in the app. Navigation between views and animated transitions are added when some behavior is not clear from static screens. We can export the prototype as a web page, so the people who will use the dashboard click through it in any browser.
- Support during the build: when our front-end developers build the dashboard, the designer answers their questions and reviews the built screens against the mockups.
We flag every design change as soon as we make it, because a small edit to a screen can change the code the developers write.
Dashboard design tips to settle before the build
Each tip below is cheaper to settle in the mockups than in code.

- One question per view: if one screen answers both “how are sales this month” and “which tickets are late,” split it into two views or two tabs.
- A comparison next to each number: a figure means little alone, so show the target, the previous period, or both.
- Filters that stay: the period and filters a user picks apply to every widget and stay when they move to another view.
- Contrast in charts: under WCAG 2.2 success criterion 1.4.11, a rule in the web accessibility standard, parts of graphics required to understand the content need a contrast ratio of at least 3:1 against adjacent colors. For example, each line of a line chart needs that contrast against the background.
- A phone version with its own job: design it for checking a few numbers or an alert, so the key metrics come first and wide tables become lists.
- AI summaries beside their numbers: analytics tools now write plain-language summaries of metrics. Tableau Pulse uses a large language model for its insight summaries, and Microsoft tells users of Copilot in Fabric to review its responses, because they can be inaccurate. If your dashboard gets such a summary, place it next to the chart and the figures it describes and label it as generated, so a reader can check each sentence against the data.
A dashboard we designed and built for a cybersecurity company
Our client, a cybersecurity company, wanted an internal dashboard that shows its employees the company's threat data. We cannot name the client because the project is under an NDA, but the screens are in the cybersecurity dashboard case study. The client set aside a limited budget to test the idea, and a UI/UX designer worked on the same team as the developers who built the dashboard.
- Users and decisions: the company's employees, who needed a quick picture of current threats, so the main design goal was to help them find important information fast.
- Views and metrics: exploited vulnerabilities, command-and-control tracking with bar charts of the countries most affected by malware, and a news feed of threat articles. Users could filter the data by malware type, location, date range, and port.
- Search and filters: employees could search incidents by keyword and filter the results by country or industry, and the matches appeared in a table with the details of each incident.
- Look: a dark theme with bright green highlights and light text, and the company's own logo in white.
- Result: the dashboard shipped with all its key features, built, according to the case study, to give the company's teams insight into threats.
Our designers also publish dashboard concepts, such as a CRM dashboard for payments and invoices and a property management dashboard with a table of bookings. These are design concepts, not client products.
What dashboard design costs at Ronas IT
Dashboard design without development starts from $2,000 at Ronas IT, for a web product or a mobile app alike, and a new dashboard is priced by how many screens it has and how complex they are. The price includes responsive layouts for desktop, tablet, and phone, and design files with a UI kit. A redesign of a dashboard you already have is priced as the table shows.
| Work | Starting price | Timeline | When it applies |
|---|---|---|---|
| Optional analysis phase | $1,000-$2,000 | At least 1 week | Before design, when the metrics, data sources, or scope are not clear yet. Otherwise analysis happens during design and is part of its price |
| UI/UX design | From $2,000 | At least 1 week | A new dashboard with its own interface, the dashboards of a new SaaS product, or a mobile app whose main screen is a dashboard |
| Product redesign | From $2,500 | At least 1 week | A dashboard people already use but struggle with |
Project management is part of these prices. A new view or a few widgets in a live product are estimated by the screens and states they touch. As a reference point, a new view usually starts from a design concept and UI kit, from $1,000, while reworking the key screens of a live dashboard is a product redesign, from $2,500. If we also build the dashboard, design is part of the build price. An internal analytics or BI tool starts from $15,000, and connecting the outside services it reads data from, such as a CRM, is included. A dashboard your customers use inside your product is priced with that product: from $5,000 for a basic MVP, from $10,000 for an extended MVP, and from $20,000 for a complex product with real-time charts or high load.
Four parts of the scope change the cost of the design work:
- Roles and views: each role with its own metrics needs its own views.
- Widgets and their states: every chart and table gets its loading, empty, and error versions.
- Platforms: a screen that only the phone version has adds design work; fitting the same screens to tablet and phone sizes is already in the price.
- Brand and components: a product that already has a brand and a UI kit gives the designer a base to start from; a new product needs both created first.
How to choose a dashboard design company
Pick a team that asks about your decisions and your data before it shows chart styles, and whose designers work alongside the developers who will build the dashboard. On the first call, ask each team these four questions and compare what they say.
- “What do you need to know before you design?” A good answer names the users, their decisions, and the data sources.
- “Can you show a dashboard you designed that went into production?” A concept shows style. A built dashboard shows that the design worked with real data.
- “What does a widget show when its data is missing?” Expect an answer about loading, empty, and error states.
- “Who builds it, and how do your designers work with them?” Design only is fine if your front-end developers will build from the UI kit. Otherwise, choose a team that designs and builds.
If you also need design work beyond the dashboard, our UI/UX design services cover web, mobile, desktop, and tablet apps.
What to do next
- Write down who will open the dashboard and which decisions each of them makes with it.
- List the metrics for each person and the system that holds each number.
- Decide which of the three cases yours is: a customer dashboard, an internal dashboard, or an admin panel.
- Decide whether your team will build the dashboard or you need design and development together.
- Ask each design team the four questions above.



Frequently Asked Questions (FAQs)
What do dashboard design services include?
They cover the work from the questions a dashboard must answer to the files developers build from: research on who uses the dashboard and for which decisions, the metrics for each view, the layout, the charts and tables, the states of each widget, and a UI kit. Building the dashboard is a separate part of the work.
How much does dashboard design cost?
At Ronas IT, the design of a new dashboard without development starts from $2,000 on any platform, and the estimate grows with the number of its screens and their complexity. A redesign of a dashboard people already use starts from $2,500 and includes a review of the current design. If we also build it, an internal analytics or BI tool starts from $15,000, while a customer-facing dashboard built into your product follows that product's price, from $5,000 for a basic MVP. Project management is part of every price, and a build price also covers the connections to the outside services the dashboard reads data from.
How long does it take to design a dashboard?
At Ronas IT, designing a new dashboard takes at least 1 week, and the estimate sets the exact time by the number of roles and views. A redesign of an existing one also takes at least 1 week. If the metrics and data sources are not clear yet, an optional analysis phase can come first: it takes at least one week and ends with a scope document, a budget, and a timeline.
How do you design a dashboard?
Start by listing who opens the dashboard and what each of them decides with it. Next, choose the metrics for each view and check where the data for each one comes from. Agree on a visual concept for a few key views and on a map of all views and widgets before the full design. Then design the screens with every state of each widget, and hand the developers a UI kit.
What are the common mistakes in dashboard design?
Mistakes that make a dashboard hard to use include too many metrics on one screen, numbers with nothing to compare them to (a target or the previous period), and chart types that do not match the question. Others are widgets that go blank when data is missing and filters that reset between views.
What is the difference between dashboard UI and UX design?
Dashboard UX design decides what the dashboard shows and how people move through it: which metrics each role sees, in what order, and where a click on a number leads. Dashboard UI design decides how it looks: the grid, the type, the colors, and the style of charts and controls.
Do dashboard designers also build the dashboard?
Some teams only design, and some design and build. Design only works when you have front-end developers who will build from the UI kit. At Ronas IT, we do both, and the designer works with our front-end developers during the build, so the screens match the design. Design and development together start from $15,000 for an internal analytics tool and from $5,000 for a customer dashboard built as part of a basic MVP; both prices already cover project management and the connections to the outside services the dashboard reads data from.
Should a dashboard work on mobile?
Yes, if people need it away from their desks. Give the phone version a smaller job than the desktop one: checking a few numbers or an alert, not analyzing data. The phone version then shows the key metrics first and turns wide tables into lists. Our web app design includes layouts for desktop, tablet, and phone.