Database optimization services: what the work includes, how it runs, and what it costs

Database optimization services find the queries that slow your product down and remove their cause: a missing index, a query that reads far more rows than it needs, a table that outgrew its design, or a server setting. At Ronas IT, a standalone technical audit runs as an analysis phase, costs $1,000 to $2,000, takes from a week, and does not cover the fixes. The same phase answers a single question, such as whether to partition a table.
This guide is for founders and product owners whose app got slower as its data grew. If the slow part is not the database, our guide to application performance optimization covers the other layers, from images and scripts to servers.
What database optimization services include
Database optimization changes the queries, indexes, server settings, and table design behind slow screens. It can also add layers that take load off the database, such as a cache or read replicas. A team first measures which queries take the most time in total, then makes the cheapest change that removes each cause. The list below shows work this service can include.
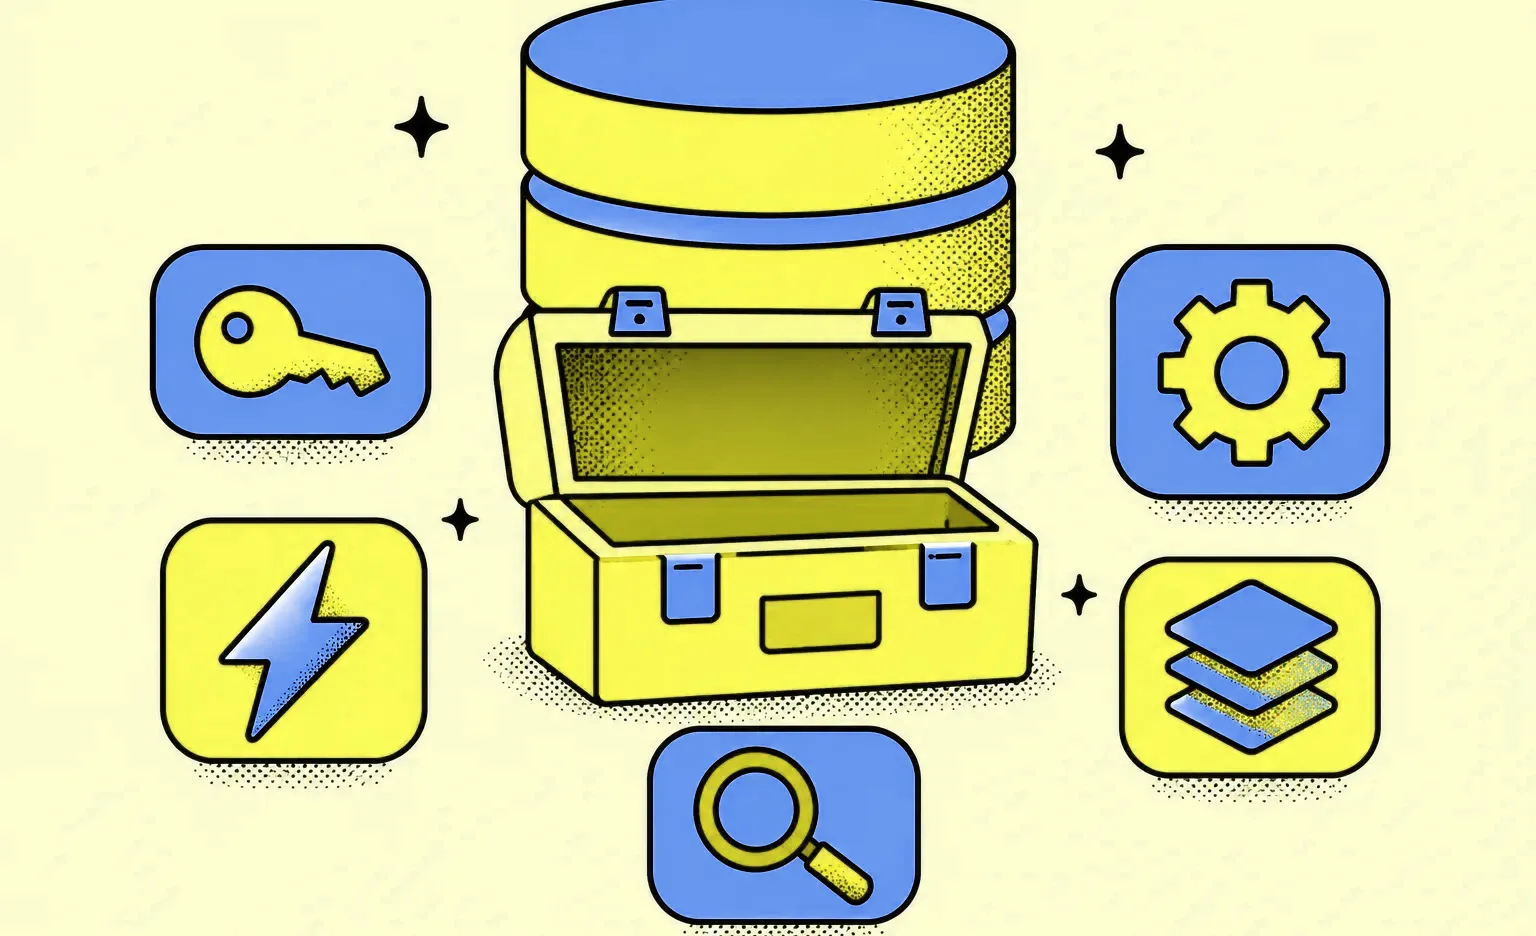
- Query analysis: collect statistics on every query and read the execution plan of the slowest ones. The plan shows whether the database uses an index or reads the whole table.
- Indexes: add the index that a frequent query needs, and remove indexes that no query uses, because the database has to update its indexes when rows are written. Check the size of the indexes you keep, too. PostgreSQL also indexes empty (NULL) values, and Haki Benita describes an index on a column that was empty in more than 99% of rows: it took 769 MB, and a partial index that left the empty values out took less than 5 MB and served the same queries.
- Query rewrites: fix code that sends one query per item of a list, reads columns the screen never shows, or sorts rows that an index could return in order.
- Configuration: set memory and connection limits for the real workload. When the app opens more connections than the server handles well, add a connection pooler, which lets many app requests share a small set of database connections.
- Partitioning and archiving: split a very large table into parts by a column that every query uses, or move old rows out of the main table.
- Caching: keep data that is read often and changes rarely in a cache such as Redis, so repeat requests skip the database. On the Waku Waku anime platform, we used Redis in front of PostgreSQL on Amazon RDS, a managed database, for frequently accessed data.
- Read replicas: send reports and other heavy reads to a copy of the database, so they do not slow down the writes your users wait for.
- Vector search: an AI feature that searches by meaning compares embeddings, lists of numbers that describe each text or image. In PostgreSQL, the pgvector extension compares a query with every row by default; an HNSW or IVFFlat index makes the search faster but “trades some recall for speed”, so some close matches can be missed. HNSW balances speed and recall better than IVFFlat, but it takes longer to build and uses more memory, so the choice is tested at real volume like any other index.
- Monitoring: keep query statistics and alerts in place after the fixes, so the next slow query shows up before users report it.
This work is part of our backend development services, and our PostgreSQL development page describes our work with that database.
How to tell that the problem is in the database
The database is the likely cause when the slow parts of the app are the ones that read or write a lot of data, and when they got slower as the data grew while the code stayed the same. Typical signs:
- Reports, search, and dashboards with long date ranges load slowly, while simple screens stay fast.
- The same page is fast for a new account and slow for an account with years of history.
- The database server's processor or disk is busy while the app servers are not.
- More app servers did not make the slow screens faster.
If the slow part is a heavy page, a script in the browser, or a server far from your users, the fix is in another layer, and a database audit will not find it.
How a database optimization project runs
The work runs in short loops: measure, fix one cause, and measure again. A loop for a single cause, such as a missing index, usually fits within one sprint, and our sprints usually last one to three weeks. Our engineers work with AI agents; an engineer decides which change ships and is responsible for it. The steps:
- Baseline. You give the team access to the code and the database metrics. The team records how long the slow screens and queries take now, so every fix is measured against the same numbers.
- Find the queries that cost the most. In PostgreSQL, the pg_stat_statements module tracks execution statistics for the statements clients send; set pg_stat_statements.track to all to count the queries that run inside functions too. In MySQL and MariaDB, the slow query log records the queries that run longer than a set time. Total time matters more than the slowest query: a 50 ms query that runs a million times a day takes 50,000 seconds of database time, and a 5-second report that runs once a day takes 5.
- Read the plans. The EXPLAIN command shows the plan the database uses for a query: which index, how many rows it expects, and where it sorts. The plan tells you whether the fix is an index, a new query, or a change to the schema.
- Fix the cheapest cause first. An index or a rewritten query comes before a schema change, and a schema change comes before new hardware.
- Test at real volume. A query that is fast on a small test database can be slow on billions of rows, so a fix is judged by its timing on data of production size. If the product runs on more than one database engine, test the fix on each. Mattermost rewrote one paging query and cut it from about 24 seconds to about 35 ms in PostgreSQL, but the same rewrite took the MySQL query from 0.18 to 5.46 seconds, so the code had to keep a separate query for each engine.
- Release with a way back. A large change, such as a table rebuild, runs while the product keeps working, and the old version stays until the new one has proved itself.
- Monitor. Query statistics and alerts stay on after the release. Our default setup after launch monitors servers with Grafana and Prometheus.
How table partitioning made one client's data retrieval about five times faster
On one client project, getting the data for statistics charts took up to 5-6 seconds on large requests. We partitioned the statistics table by the ID that every query used, data retrieval became about five times faster, and the team found no lost incoming rows after the switch.

The problem
The product ran on MariaDB, and the statistics table held about 4 billion rows. The right indexes were already in place and in use. The client did not want to pay for a separate database for statistics, so the fix had to work inside the existing one. Two facts made partitioning a good fit: only one part of the app used the table, and every query filtered by the same column, the ID of the record the statistics belonged to.
The fix
We chose HASH partitioning by that ID. With HASH, the server decides which partition holds each row, and the MariaDB documentation describes this as “ensuring an even distribution among the partitions”. We picked 100 partitions after performance tests:
ALTER TABLE statistics_with_partitions
  PARTITION BY HASH(record_id)
  PARTITIONS 100;
Because every query named the ID, the database searched only the partition that held rows with that ID. MariaDB calls this partition pruning: “Other partitions will not be read”. In MariaDB, both data and indexes are partitioned, so each query used the smaller index of one partition instead of the index of the whole table.
One rule shaped the new table. In MySQL and MariaDB, every unique key must use every column of the partitioning expression, so the primary key became the pair of the row ID and the record ID.
The switch without downtime
New rows came in all the time from the client's third-party service, from 2 to 1,000 every 4-6 minutes, and that flow could not stop. We created the partitioned table next to the old one, and a Laravel console command copied the rows over in batches. Once the last row in both tables matched, the command renamed the old table to a backup and gave its name to the new table. The backup meant the switch could be undone by renaming the tables back.
Today we would add one step to this method. A row written between the last comparison and the rename stays only in the backup, and a row written after the switch is lost if the backup is renamed back into place. The code that receives the rows would write each of them to both tables in one database transaction, so a row lands in both or in neither, and keep doing so until the way back is no longer needed. That closes both gaps.
When partitioning helps, and when it does not
Partitioning helps when a table is very large and almost every query filters by the same column. The PostgreSQL documentation gives a rule of thumb: “the size of the table should exceed the physical memory of the database server”. For a smaller table, start with indexes and queries.
On the same client project, a smaller table needed only an index. In 2026, a new lookup, cached for an hour, had to find 112 rows in a table of 7.8 million. Without an index, MariaDB read every row to find them, which took 4.2 seconds on the production database. The lookup therefore shipped together with one composite index, an index that covers more than one column, so the database no longer has to read every row of the table.
Before you partition a table, weigh what partitioning changes:
- Queries without the partition column: the database cannot skip any partition, so it has to look into all of them.
- The number of partitions: PostgreSQL warns that too many partitions “can mean longer query planning times and higher memory consumption”.
- Keys: unique keys, including the primary key, have to include the partition column in PostgreSQL, MySQL, and MariaDB.
- Foreign keys: in MySQL, partitioned InnoDB tables do not support them, and MariaDB does not allow a partitioned table to contain or be referenced by them.
- Parallel work: the same MariaDB page says that “queries are never parallelized, even when they involve multiple partitions”. The speed comes from reading less data.
- Old data: with monthly partitions, removing a month of old rows means dropping one partition, which PostgreSQL describes as “far faster than a bulk operation”.
“Before I suggest partitioning, I ask how the app will read that table after the next few features ship. The partition column is hard to change once the data is split, so it has to fit the queries you plan, not only the ones you run today.”
Alexander Storozhevsky, Lead developer at Ronas IT
What database optimization costs at Ronas IT
To find the cause of a slowdown, work starts with a technical audit, run as our analysis phase. We set the audit scope once we have looked at your code and database. The audit price does not include the fixes: they get their own estimate after the audit, since adding one index and rebuilding a table differ greatly in effort. If you also want technical direction, architecture design, and roadmap planning while the fixes are made, our CTO as a service work runs as a dedicated team.
| Work | Price | When to choose it |
|---|---|---|
| Technical audit (analysis phase) | $1,000-$2,000, and takes at least 1 week | The cause is unknown and you need a written diagnosis with a plan of fixes, or one question needs an expert answer, such as an index plan or a partitioning choice |
| Fixes | Estimated after the audit | The audit found a short list of fixes with a clear scope |
| Dedicated development team | From $8,000 per month | The audit found many fixes, or part of the data model has to be rebuilt: two developers who use AI agents plus a part-time project manager; the makeup of the team is agreed for the work |
| Support and maintenance | From $1,000 per month for an app, from $2,000 for a whole system | After the fixes, the product needs monitoring, fixes, and updates |
| DevOps and hosting | From $200 per month | After the fixes, the query statistics, alerts, and server monitoring stay on |
How to choose a database optimization team
Choose a team that measures before it changes anything, can show a past fix and what it changed, plans a way back for every large change, and leaves the monitoring with you. Before you sign, ask one question for each:
- What will you measure first? Expect query statistics and execution plans, not a proposal for a bigger server.
- Which fix can you show? Ask for one past fix, the database it ran on, and how much faster it made the queries.
- What is the way back? A schema change should come with a rollback, such as keeping the old table until the new one works.
- What stays after you leave? Query statistics, alerts, and a short record of what was changed and why should stay with your team.
What to do next
- List the screens and reports that users say are slow, and note how long each one takes now.
- Turn on query statistics: pg_stat_statements in PostgreSQL, or the slow query log in MySQL and MariaDB.
- Run EXPLAIN on the slowest queries and check whether they use an index.
- Consider partitioning only for a very large table that almost every query reads by the same column.


Frequently Asked Questions (FAQs)
What is database optimization?
Database optimization is the work of making a database answer queries faster and with less load, without changing what the application does for its users. The work begins by finding the queries that use the most database time. The cause of each is then removed with the cheapest change that works, such as an index, a query, a setting, or the table design.
What is the difference between database tuning and database optimization?
The terms overlap. Tuning usually means changing the server settings, such as memory and connection limits, to match the workload. Optimization is wider: it also changes queries, indexes, and the schema. A slow database can need both, and the measurements show which one to start with.
How do you monitor database performance?
Collect query statistics and set alerts on slow queries. In PostgreSQL, the pg_stat_statements module tracks the statements clients send, and the queries inside functions only with pg_stat_statements.track set to all; it is loaded through shared_preload_libraries, so adding it needs a server restart, as the PostgreSQL documentation explains. In MySQL and MariaDB, the slow query log records queries that run longer than a time limit you set; the MySQL manual describes its settings. Add server metrics, such as processor, memory, disk, and connections, in a tool like Grafana with Prometheus.
What is the difference between sharding and partitioning?
Partitioning splits one table into parts inside one database server, and queries still see one table. Sharding spreads the data across several database servers, and the application or a routing layer has to know which server holds each row. Sharding adds servers to run, so consider it only after one server has been tuned.
Can a database be optimized without downtime?
Much of the work can. Query rewrites and many settings can go out while the product runs. Indexes need care on a large table: in PostgreSQL, a standard index build locks out writes until it is done, and the CONCURRENTLY option avoids that lock at the cost of a longer build. A table rebuild can run next to the old table and switch over by renaming, as long as new writes reach both tables until the window for rolling the switch back closes.
Is a bigger server enough to fix a slow database?
Sometimes, for a while. More memory helps when the data that queries read often no longer fits in it. A query that reads a whole table because an index is missing stays slow on a bigger server, and it gets slower as the table grows.
How long does database optimization take?
The audit takes longer for a larger codebase and database. Fixing one cause, for example adding a missing index, and measuring the result usually fits within one sprint. Our sprints usually run one to three weeks. A table rebuild or a change to the data model is planned as separate work after the audit.
How much do database optimization services cost?
A standalone technical audit runs as our analysis phase: $1,000 to $2,000 and at least one week, with a written plan of fixes. The fixes get their own estimate, depending on what the audit finds, or a dedicated team takes them on from $8,000 per month. Monitoring and updates after the fixes start at $1,000 per month for an app.